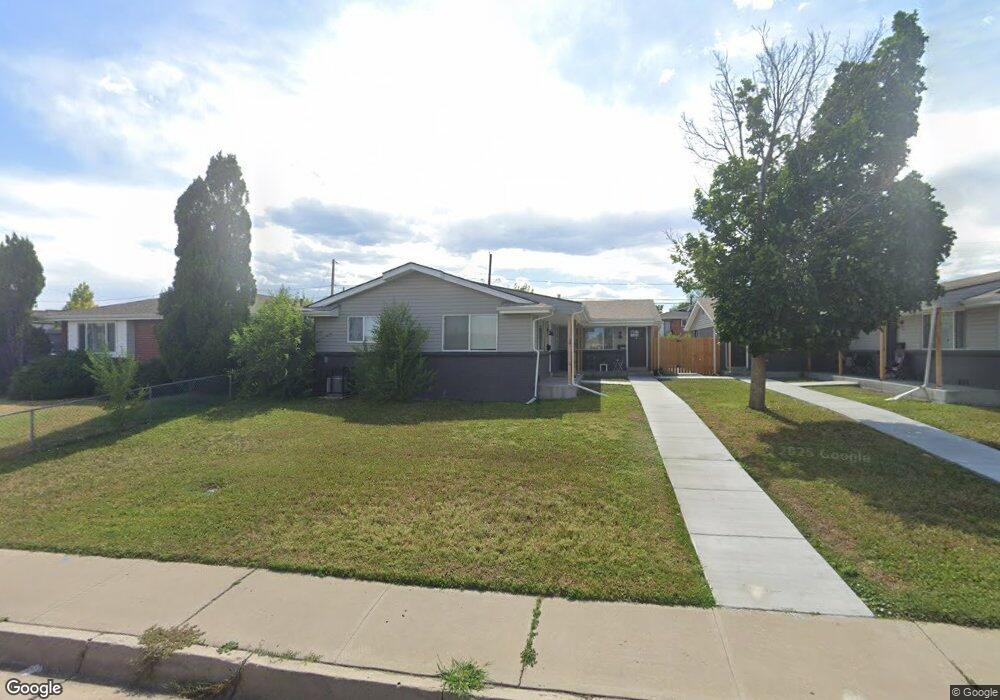
2015 Depew St Edgewater, CO 80214
Estimated Value: $687,000 - $856,000
3
Beds
1
Bath
974
Sq Ft
$791/Sq Ft
Est. Value
About This Home
This home is located at 2015 Depew St, Edgewater, CO 80214 and is currently estimated at $770,626, approximately $791 per square foot. 2015 Depew St is a home located in Jefferson County with nearby schools including Edgewater Elementary School, Jefferson High School, and Colorado High School Charter - Osage.
Ownership History
Date
Name
Owned For
Owner Type
Purchase Details
Closed on
Apr 27, 2023
Sold by
2015-2017 Depew Street Llc
Bought by
Rocky Mountain Real Estate And Investments Ll
Current Estimated Value
Home Financials for this Owner
Home Financials are based on the most recent Mortgage that was taken out on this home.
Original Mortgage
$2,013,500
Outstanding Balance
$1,654,604
Interest Rate
6.6%
Mortgage Type
New Conventional
Estimated Equity
-$883,978
Purchase Details
Closed on
Oct 21, 2011
Sold by
Duveneck Richard
Bought by
2015-2017 Depew Street Llc
Purchase Details
Closed on
May 6, 2011
Sold by
Jeffco Housing Corporation
Bought by
Duveneck Richard
Home Financials for this Owner
Home Financials are based on the most recent Mortgage that was taken out on this home.
Original Mortgage
$154,000
Interest Rate
4.62%
Mortgage Type
Adjustable Rate Mortgage/ARM
Create a Home Valuation Report for This Property
The Home Valuation Report is an in-depth analysis detailing your home's value as well as a comparison with similar homes in the area
Home Values in the Area
Average Home Value in this Area
Purchase History
| Date | Buyer | Sale Price | Title Company |
|---|---|---|---|
| Rocky Mountain Real Estate And Investments Ll | $650,000 | Fitco | |
| 2015-2017 Depew Street Llc | $500 | Titleone Of Colorado | |
| Duveneck Richard | $192,500 | None Available |
Source: Public Records
Mortgage History
| Date | Status | Borrower | Loan Amount |
|---|---|---|---|
| Open | Rocky Mountain Real Estate And Investments Ll | $2,013,500 | |
| Previous Owner | Duveneck Richard | $154,000 |
Source: Public Records
Tax History
| Year | Tax Paid | Tax Assessment Tax Assessment Total Assessment is a certain percentage of the fair market value that is determined by local assessors to be the total taxable value of land and additions on the property. | Land | Improvement |
|---|---|---|---|---|
| 2024 | $3,817 | $44,740 | $16,428 | $28,312 |
| 2023 | $3,817 | $44,740 | $16,428 | $28,312 |
| 2022 | $2,792 | $32,146 | $13,874 | $18,272 |
| 2021 | $2,893 | $33,801 | $14,589 | $19,212 |
| 2020 | $2,650 | $31,130 | $14,097 | $17,033 |
| 2019 | $2,613 | $31,130 | $14,097 | $17,033 |
| 2018 | $2,723 | $31,346 | $11,425 | $19,921 |
| 2017 | $2,452 | $31,346 | $11,425 | $19,921 |
| 2016 | $1,974 | $23,587 | $5,645 | $17,942 |
| 2015 | $1,001 | $23,587 | $5,645 | $17,942 |
| 2014 | $1,459 | $16,342 | $4,872 | $11,470 |
Source: Public Records
Map
Nearby Homes
- 1939 Eaton St
- 2235 Eaton St
- 1720 Fenton St
- 2355 Ames St
- 1753 Harlan St Unit 1
- 1753 Harlan St Unit 2
- 1751 Harlan St Unit 1
- 1751 Harlan St Unit 2
- 1995 Ingalls St
- 2275 Harlan St
- 2428 Ames St
- 2454 Harlan St
- 2025 Jay St
- 5419 W 16th Ave
- 5415 W 16th Ave
- 5343 W 16th Ave Unit 3
- 1634 N Sheridan Blvd Unit 104
- 1634 N Sheridan Blvd Unit 105
- 1634 N Sheridan Blvd Unit 204
- 1650 Sheridan Blvd Unit 106
Your Personal Tour Guide
Ask me questions while you tour the home.