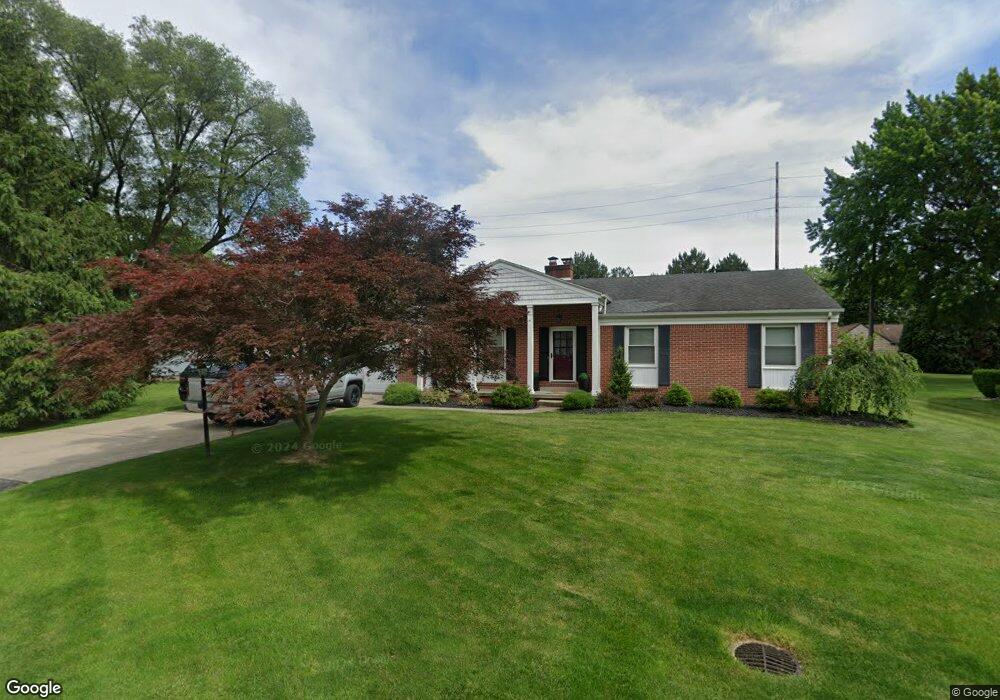
2015 Elm Dr Fremont, OH 43420
Estimated Value: $223,000 - $295,000
4
Beds
2
Baths
1,673
Sq Ft
$148/Sq Ft
Est. Value
About This Home
This home is located at 2015 Elm Dr, Fremont, OH 43420 and is currently estimated at $246,774, approximately $147 per square foot. 2015 Elm Dr is a home located in Sandusky County with nearby schools including Fremont Ross High School, St. Joseph School, and Bishop Hoffman Catholic School - This is St Joe's School now.
Ownership History
Date
Name
Owned For
Owner Type
Purchase Details
Closed on
May 25, 2018
Sold by
Mason Martin G and Mason Barbara A
Bought by
Trimble Trevor A and Trimble Natashia K
Current Estimated Value
Home Financials for this Owner
Home Financials are based on the most recent Mortgage that was taken out on this home.
Original Mortgage
$149,150
Outstanding Balance
$128,423
Interest Rate
4.4%
Mortgage Type
New Conventional
Estimated Equity
$118,351
Purchase Details
Closed on
Jul 6, 2000
Sold by
Trst Joseph K Siesel
Bought by
Mason Martin G and Mason Barbara A
Home Financials for this Owner
Home Financials are based on the most recent Mortgage that was taken out on this home.
Original Mortgage
$107,600
Interest Rate
8.64%
Mortgage Type
New Conventional
Purchase Details
Closed on
May 1, 1984
Bought by
Mason Martin G and Mason Barbara A
Create a Home Valuation Report for This Property
The Home Valuation Report is an in-depth analysis detailing your home's value as well as a comparison with similar homes in the area
Home Values in the Area
Average Home Value in this Area
Purchase History
| Date | Buyer | Sale Price | Title Company |
|---|---|---|---|
| Trimble Trevor A | $157,000 | None Available | |
| Mason Martin G | $134,500 | -- | |
| Mason Martin G | $76,000 | -- |
Source: Public Records
Mortgage History
| Date | Status | Borrower | Loan Amount |
|---|---|---|---|
| Open | Trimble Trevor A | $149,150 | |
| Previous Owner | Mason Martin G | $107,600 |
Source: Public Records
Tax History Compared to Growth
Tax History
| Year | Tax Paid | Tax Assessment Tax Assessment Total Assessment is a certain percentage of the fair market value that is determined by local assessors to be the total taxable value of land and additions on the property. | Land | Improvement |
|---|---|---|---|---|
| 2024 | $2,540 | $65,350 | $11,800 | $53,550 |
| 2023 | $2,540 | $55,860 | $10,080 | $45,780 |
| 2022 | $2,318 | $55,860 | $10,080 | $45,780 |
| 2021 | $2,389 | $55,860 | $10,080 | $45,780 |
| 2020 | $2,323 | $53,270 | $10,080 | $43,190 |
| 2019 | $2,321 | $53,270 | $10,080 | $43,190 |
| 2018 | $2,145 | $53,270 | $10,080 | $43,190 |
| 2017 | $2,031 | $47,640 | $10,080 | $37,560 |
| 2016 | $1,780 | $47,640 | $10,080 | $37,560 |
| 2015 | $1,751 | $47,640 | $10,080 | $37,560 |
| 2014 | $1,875 | $48,860 | $9,940 | $38,920 |
| 2013 | $1,835 | $48,860 | $9,940 | $38,920 |
Source: Public Records
Map
Nearby Homes
- 1719 Buckland Ave
- 2484 Buckland Ave
- 1485 Autumn Woods Dr
- 1420 Center St
- 1611 Mcpherson Blvd
- 10 Meadowbrook Dr
- 10 Meadowbrook Ln
- 1028 June St
- 64 River Run Dr Unit J
- 515 Everett Rd
- 1013 Whittlesey St
- 905 Twinn St
- 1015 Hayes Ave
- 1037 Buckland Ave
- 2119 Lake St
- 815 South St
- 616 S Wood St
- 135 Briarwood Cir
- 625 Bush Place
- 1009 Napoleon St