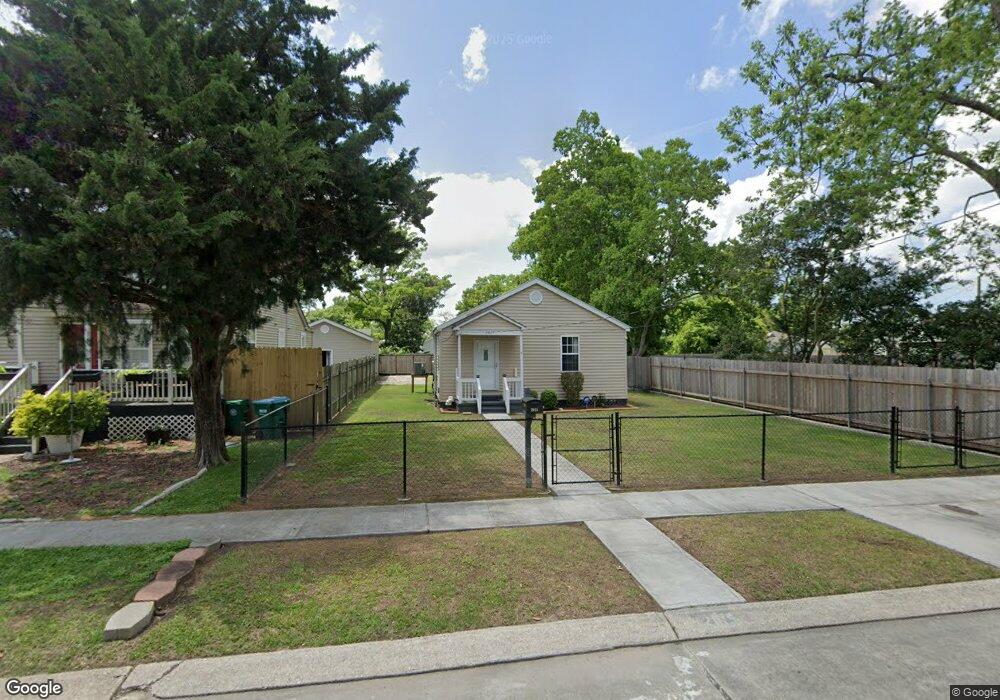
2015 Iowa Ave Kenner, LA 70062
Estimated Value: $145,529 - $235,000
2
Beds
1
Bath
715
Sq Ft
$255/Sq Ft
Est. Value
About This Home
This home is located at 2015 Iowa Ave, Kenner, LA 70062 and is currently estimated at $182,382, approximately $255 per square foot. 2015 Iowa Ave is a home located in Jefferson Parish with nearby schools including Airline Park Academy For Advanced Studies, T.H. Harris Middle School, and East Jefferson High School.
Ownership History
Date
Name
Owned For
Owner Type
Purchase Details
Closed on
May 26, 2016
Sold by
Figueredo Rebecca Woodruff and Woodruff Debra Dubue
Bought by
Ringgold Emile A
Current Estimated Value
Home Financials for this Owner
Home Financials are based on the most recent Mortgage that was taken out on this home.
Original Mortgage
$112,000
Outstanding Balance
$89,169
Interest Rate
3.58%
Mortgage Type
VA
Estimated Equity
$93,213
Purchase Details
Closed on
Jul 18, 2003
Sold by
Davidson Donald E
Bought by
R Davidson Prop L L C
Create a Home Valuation Report for This Property
The Home Valuation Report is an in-depth analysis detailing your home's value as well as a comparison with similar homes in the area
Home Values in the Area
Average Home Value in this Area
Purchase History
| Date | Buyer | Sale Price | Title Company |
|---|---|---|---|
| Ringgold Emile A | $112,000 | Crescent Title Llc | |
| R Davidson Prop L L C | $25,000 | -- |
Source: Public Records
Mortgage History
| Date | Status | Borrower | Loan Amount |
|---|---|---|---|
| Open | Ringgold Emile A | $112,000 |
Source: Public Records
Tax History Compared to Growth
Tax History
| Year | Tax Paid | Tax Assessment Tax Assessment Total Assessment is a certain percentage of the fair market value that is determined by local assessors to be the total taxable value of land and additions on the property. | Land | Improvement |
|---|---|---|---|---|
| 2024 | $5,181 | $11,200 | $3,500 | $7,700 |
| 2023 | $119 | $11,200 | $3,500 | $7,700 |
| 2022 | $1,091 | $11,200 | $3,500 | $7,700 |
| 2021 | $1,006 | $11,200 | $3,500 | $7,700 |
| 2020 | $997 | $11,200 | $3,500 | $7,700 |
| 2019 | $1,017 | $11,200 | $3,500 | $7,700 |
| 2018 | $735 | $11,200 | $3,500 | $7,700 |
| 2017 | $927 | $11,200 | $3,500 | $7,700 |
| 2016 | $927 | $11,200 | $3,500 | $7,700 |
| 2015 | $696 | $10,500 | $3,500 | $7,000 |
| 2014 | $696 | $10,500 | $3,500 | $7,000 |
Source: Public Records
Map
Nearby Homes