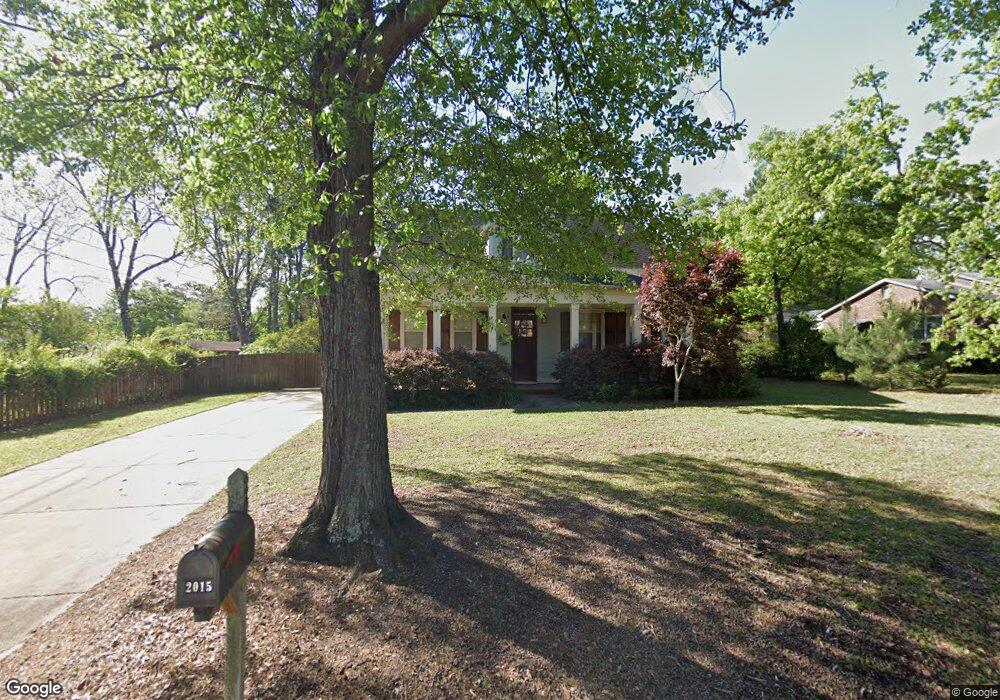
2015 Klapman Rd West Columbia, SC 29169
Estimated Value: $324,744 - $420,000
3
Beds
3
Baths
2,258
Sq Ft
$162/Sq Ft
Est. Value
About This Home
This home is located at 2015 Klapman Rd, West Columbia, SC 29169 and is currently estimated at $364,686, approximately $161 per square foot. 2015 Klapman Rd is a home located in Lexington County with nearby schools including Riverbank Elementary, Northside Middle, and Brookland-Cayce High School.
Ownership History
Date
Name
Owned For
Owner Type
Purchase Details
Closed on
Feb 12, 2016
Sold by
Mckoy Clint T and Mckoy Jessica A
Bought by
Current Diane C
Current Estimated Value
Purchase Details
Closed on
Dec 29, 2011
Sold by
Fortress Builders Llc
Bought by
Mckoy Clint T and Mckoy Jessica A
Home Financials for this Owner
Home Financials are based on the most recent Mortgage that was taken out on this home.
Original Mortgage
$251,230
Interest Rate
4.06%
Mortgage Type
Future Advance Clause Open End Mortgage
Purchase Details
Closed on
Aug 25, 2011
Sold by
Fuller David I
Bought by
Fortress Builders Llc
Home Financials for this Owner
Home Financials are based on the most recent Mortgage that was taken out on this home.
Original Mortgage
$195,000
Interest Rate
4.54%
Mortgage Type
Future Advance Clause Open End Mortgage
Create a Home Valuation Report for This Property
The Home Valuation Report is an in-depth analysis detailing your home's value as well as a comparison with similar homes in the area
Home Values in the Area
Average Home Value in this Area
Purchase History
| Date | Buyer | Sale Price | Title Company |
|---|---|---|---|
| Current Diane C | $242,500 | None Available | |
| Mckoy Clint T | $259,008 | -- | |
| Fortress Builders Llc | $28,500 | -- |
Source: Public Records
Mortgage History
| Date | Status | Borrower | Loan Amount |
|---|---|---|---|
| Previous Owner | Mckoy Clint T | $251,230 | |
| Previous Owner | Fortress Builders Llc | $195,000 |
Source: Public Records
Tax History Compared to Growth
Tax History
| Year | Tax Paid | Tax Assessment Tax Assessment Total Assessment is a certain percentage of the fair market value that is determined by local assessors to be the total taxable value of land and additions on the property. | Land | Improvement |
|---|---|---|---|---|
| 2024 | $6,336 | $14,713 | $2,100 | $12,613 |
| 2023 | $5,807 | $14,713 | $2,100 | $12,613 |
| 2022 | $5,499 | $14,713 | $2,100 | $12,613 |
| 2020 | $5,214 | $14,713 | $2,100 | $12,613 |
| 2019 | $5,210 | $14,550 | $2,100 | $12,450 |
| 2018 | $5,168 | $14,550 | $2,100 | $12,450 |
| 2017 | $5,071 | $14,550 | $2,100 | $12,450 |
| 2016 | $1,882 | $9,982 | $1,400 | $8,582 |
| 2015 | $1,463 | $9,982 | $1,400 | $8,582 |
| 2014 | $1,463 | $10,198 | $1,400 | $8,798 |
| 2013 | -- | $10,200 | $1,400 | $8,800 |
Source: Public Records
Map
Nearby Homes
- 500 Finnegan Ln
- 529 Finnegan Ln
- 0 Sunset Blvd Unit 553428
- 623 Hook Ave
- 0 Platt Springs Rd Unit 606355
- 165 Cavendish Dr
- 1715 Gilvie Ave
- 2004 Dew Ave
- 100 Double Branch Ct
- 108 Double Branch Ct
- 1513 Gambrell St
- 207 Woodhaven Dr
- 215 Sandel Ln
- 292 Marabou Cir
- 617 Holland Cir
- 235 Harvest Glen Ln
- 913 Harper Rose Ct
- 161 Weeping Oak Ln
- 13 Janice Fe Trail
- 7 Janice Fe Trail
- 2021 Klapman Rd
- 927 Kim St
- 929 Kim St
- 920 Victoria St
- 923 Kim St
- 2101 Klapman Rd
- 917 Victoria St
- 2119 Sunset Blvd
- 908 Victoria St
- 913 Victoria St
- 2025 Ervin St
- 201 Congaree Mill Ln
- 2024 Ervin St
- 916 Kim St
- 909 Victoria St
- 205 Congaree Mill Ln
- 209 Congaree Mill Ln
- 901 Kim St
- 213 Congaree Mill Ln
- 900 Victoria St