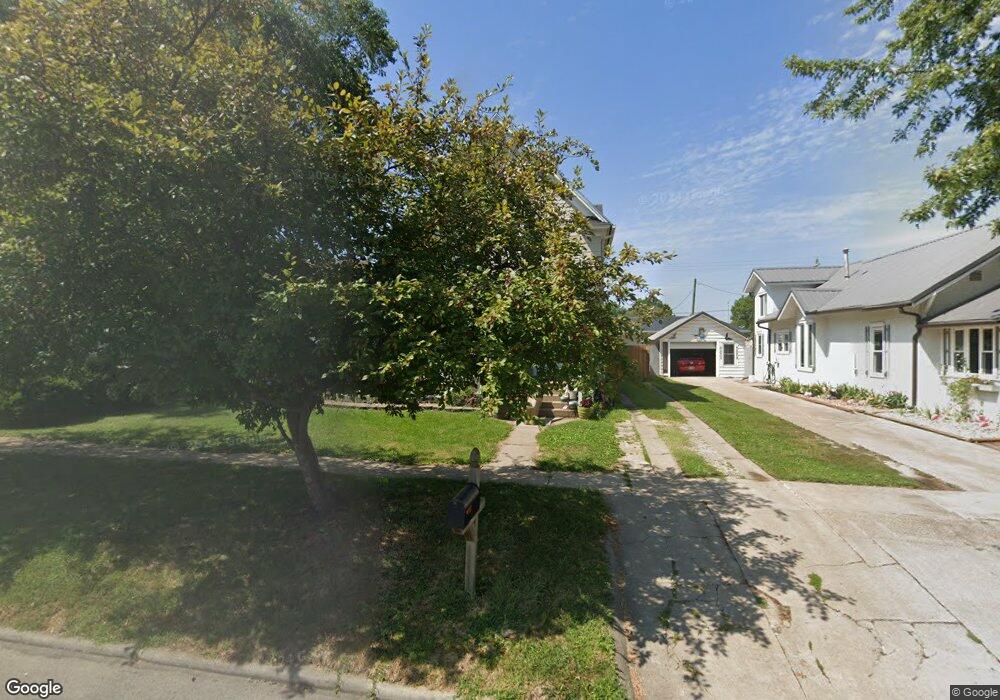
2015 Lane St Falls City, NE 68355
Estimated Value: $98,531 - $114,000
2
Beds
2
Baths
1,575
Sq Ft
$68/Sq Ft
Est. Value
About This Home
This home is located at 2015 Lane St, Falls City, NE 68355 and is currently estimated at $106,883, approximately $67 per square foot. 2015 Lane St is a home located in Richardson County with nearby schools including Falls City North Elementary School, Falls City South Elementary School, and Falls City Middle School.
Ownership History
Date
Name
Owned For
Owner Type
Purchase Details
Closed on
Dec 15, 2015
Sold by
Buchholz Alesia L
Bought by
Mcqueen Thomas L and Mcqueen Shannan
Current Estimated Value
Purchase Details
Closed on
Feb 26, 2010
Sold by
Mcneely James Erik and Mcneely Sandra S
Bought by
Buchholz Alesia L
Purchase Details
Closed on
Feb 25, 2008
Sold by
U S Bank N A
Bought by
Mcneely James Erik and Mcneely Sandra S
Purchase Details
Closed on
Jul 17, 2007
Sold by
O'Brien Rufina A
Bought by
U S Bank N A
Purchase Details
Closed on
May 10, 2006
Sold by
Dean Iii Arthur
Bought by
O'Brien Rufina A
Create a Home Valuation Report for This Property
The Home Valuation Report is an in-depth analysis detailing your home's value as well as a comparison with similar homes in the area
Home Values in the Area
Average Home Value in this Area
Purchase History
| Date | Buyer | Sale Price | Title Company |
|---|---|---|---|
| Mcqueen Thomas L | $70,000 | -- | |
| Buchholz Alesia L | $41,000 | -- | |
| Mcneely James Erik | $21,900 | -- | |
| U S Bank N A | $36,550 | -- | |
| O'Brien Rufina A | $45,000 | -- |
Source: Public Records
Tax History Compared to Growth
Tax History
| Year | Tax Paid | Tax Assessment Tax Assessment Total Assessment is a certain percentage of the fair market value that is determined by local assessors to be the total taxable value of land and additions on the property. | Land | Improvement |
|---|---|---|---|---|
| 2025 | $697 | $65,520 | $3,600 | $61,920 |
| 2024 | $697 | $62,015 | $3,600 | $58,415 |
| 2023 | $1,330 | $81,049 | $3,600 | $77,449 |
| 2022 | $1,466 | $76,350 | $1,620 | $74,730 |
| 2021 | $975 | $52,057 | $1,620 | $50,437 |
| 2020 | $940 | $49,655 | $1,620 | $48,035 |
| 2019 | $928 | $48,256 | $1,620 | $46,636 |
| 2018 | $911 | $46,898 | $1,620 | $45,278 |
| 2017 | $913 | $46,898 | $1,620 | $45,278 |
| 2016 | $883 | $45,579 | $1,620 | $43,959 |
| 2015 | $931 | $47,888 | $1,620 | $46,268 |
| 2014 | $929 | $47,888 | $1,620 | $46,268 |
Source: Public Records
Map
Nearby Homes