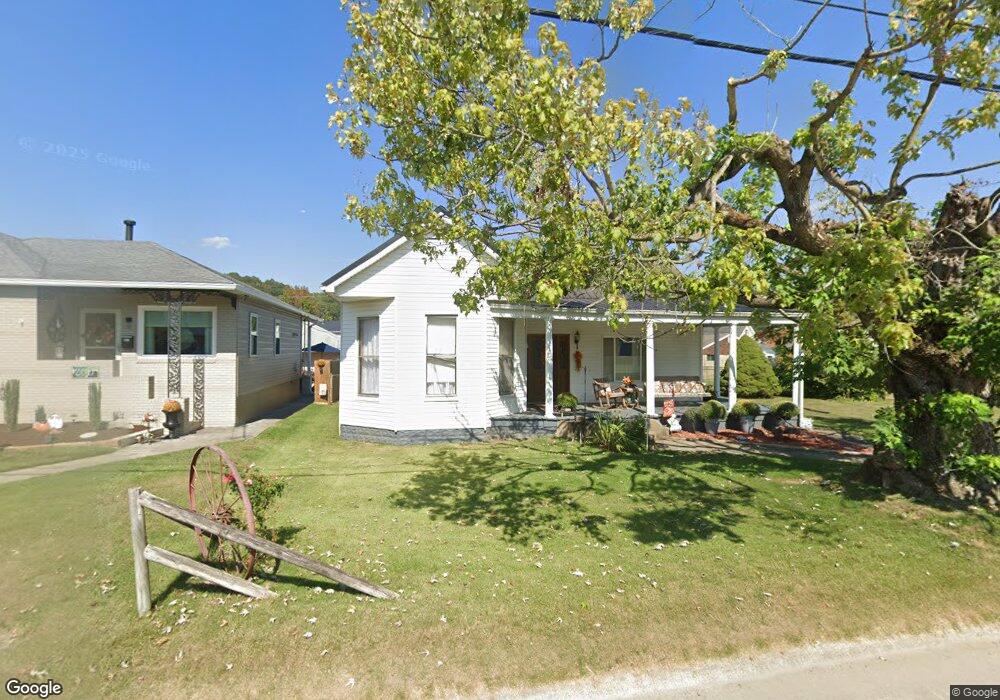
2015 N 2nd St Ironton, OH 45638
Estimated Value: $130,964 - $201,000
2
Beds
1
Bath
1,604
Sq Ft
$95/Sq Ft
Est. Value
About This Home
This home is located at 2015 N 2nd St, Ironton, OH 45638 and is currently estimated at $152,241, approximately $94 per square foot. 2015 N 2nd St is a home located in Lawrence County with nearby schools including Ironton Elementary School, Ironton Middle School, and Ironton High School.
Ownership History
Date
Name
Owned For
Owner Type
Purchase Details
Closed on
Jan 29, 2021
Sold by
Kennedy Jessica and Kennedy Tracy Denise
Bought by
Taylor Jerry and Taylor Becky
Current Estimated Value
Purchase Details
Closed on
Jan 22, 2021
Sold by
Kennedy Patrick D
Bought by
Kennedy Jessica
Purchase Details
Closed on
Mar 5, 2014
Sold by
Kennedy Patrick D
Bought by
Kennedy Jessica
Purchase Details
Closed on
Jan 8, 2002
Bought by
Kennedy Jessica Life Est Rem Patrick D &
Purchase Details
Closed on
Jul 13, 1995
Sold by
Kennedy Jessica
Bought by
Kennedy, Jessica Life Est
Purchase Details
Closed on
Oct 30, 1989
Sold by
Artis Phillip C and Artis Cath
Bought by
Kennedy Jessica
Create a Home Valuation Report for This Property
The Home Valuation Report is an in-depth analysis detailing your home's value as well as a comparison with similar homes in the area
Home Values in the Area
Average Home Value in this Area
Purchase History
| Date | Buyer | Sale Price | Title Company |
|---|---|---|---|
| Taylor Jerry | $65,000 | None Available | |
| Kennedy Jessica | -- | None Available | |
| Kennedy Jessica | -- | None Available | |
| Kennedy Jessica Life Est Rem Patrick D & | -- | -- | |
| Kennedy, Jessica Life Est | -- | -- | |
| Kennedy Jessica | $29,900 | -- |
Source: Public Records
Tax History Compared to Growth
Tax History
| Year | Tax Paid | Tax Assessment Tax Assessment Total Assessment is a certain percentage of the fair market value that is determined by local assessors to be the total taxable value of land and additions on the property. | Land | Improvement |
|---|---|---|---|---|
| 2024 | -- | $28,210 | $5,120 | $23,090 |
| 2023 | $1,046 | $28,210 | $5,120 | $23,090 |
| 2022 | $1,046 | $28,210 | $5,120 | $23,090 |
| 2021 | $930 | $24,140 | $4,240 | $19,900 |
| 2020 | $946 | $24,140 | $4,240 | $19,900 |
| 2019 | $942 | $24,140 | $4,240 | $19,900 |
| 2018 | $953 | $24,140 | $4,240 | $19,900 |
| 2017 | $951 | $24,140 | $4,240 | $19,900 |
| 2016 | $893 | $24,140 | $4,240 | $19,900 |
| 2015 | $814 | $21,230 | $4,670 | $16,560 |
| 2014 | $787 | $21,230 | $4,670 | $16,560 |
| 2013 | $785 | $21,230 | $4,670 | $16,560 |
Source: Public Records
Map
Nearby Homes