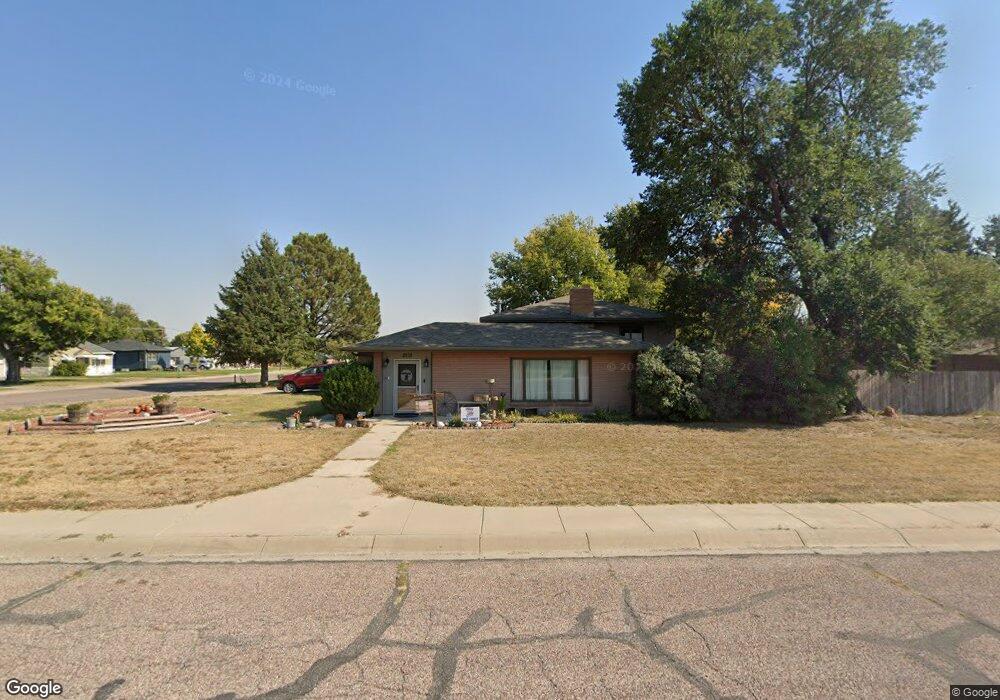
2015 O St Gering, NE 69341
Estimated Value: $254,000 - $299,668
4
Beds
4
Baths
2,303
Sq Ft
$119/Sq Ft
Est. Value
About This Home
This home is located at 2015 O St, Gering, NE 69341 and is currently estimated at $272,917, approximately $118 per square foot. 2015 O St is a home located in Scotts Bluff County with nearby schools including Gering High School and Community Christian Elementary/Middle School.
Ownership History
Date
Name
Owned For
Owner Type
Purchase Details
Closed on
Jul 2, 2012
Sold by
Western Heritage Credit Uniion
Bought by
Dondelinger Troy M and Dondelinger Dayna L
Current Estimated Value
Home Financials for this Owner
Home Financials are based on the most recent Mortgage that was taken out on this home.
Original Mortgage
$124,755
Outstanding Balance
$85,311
Interest Rate
3.7%
Mortgage Type
FHA
Estimated Equity
$187,606
Purchase Details
Closed on
Feb 24, 2012
Sold by
Ensrud Daniel and Ensrud Gwendolyn
Bought by
Western Heritage Cu
Create a Home Valuation Report for This Property
The Home Valuation Report is an in-depth analysis detailing your home's value as well as a comparison with similar homes in the area
Home Values in the Area
Average Home Value in this Area
Purchase History
| Date | Buyer | Sale Price | Title Company |
|---|---|---|---|
| Dondelinger Troy M | $128,000 | None Available | |
| Western Heritage Cu | $125,000 | None Available |
Source: Public Records
Mortgage History
| Date | Status | Borrower | Loan Amount |
|---|---|---|---|
| Open | Dondelinger Troy M | $124,755 |
Source: Public Records
Tax History
| Year | Tax Paid | Tax Assessment Tax Assessment Total Assessment is a certain percentage of the fair market value that is determined by local assessors to be the total taxable value of land and additions on the property. | Land | Improvement |
|---|---|---|---|---|
| 2025 | $4,122 | $245,020 | $27,710 | $217,310 |
| 2024 | $3,924 | $225,265 | $27,710 | $197,555 |
| 2023 | $3,736 | $174,322 | $13,774 | $160,548 |
| 2022 | $3,736 | $174,322 | $13,774 | $160,548 |
| 2021 | $3,550 | $163,819 | $13,774 | $150,045 |
| 2020 | $3,415 | $156,674 | $13,774 | $142,900 |
| 2019 | $3,335 | $156,802 | $13,902 | $142,900 |
| 2018 | $3,355 | $156,802 | $13,902 | $142,900 |
| 2017 | $3,242 | $151,306 | $13,902 | $137,404 |
| 2016 | $3,009 | $151,306 | $13,902 | $137,404 |
| 2015 | $2,920 | $147,304 | $13,902 | $133,402 |
| 2014 | $2,763 | $137,422 | $13,902 | $123,520 |
| 2012 | -- | $170,128 | $13,902 | $156,226 |
Source: Public Records
Map
Nearby Homes
Your Personal Tour Guide
Ask me questions while you tour the home.