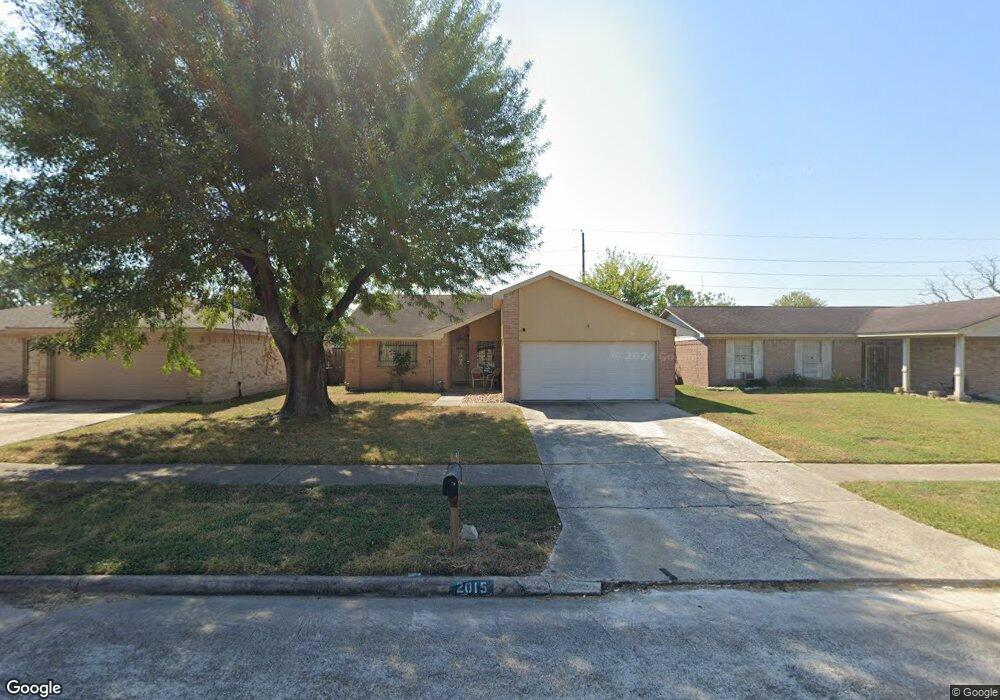
2015 Ravenwind Rd Houston, TX 77067
Northside NeighborhoodEstimated Value: $193,000 - $202,000
3
Beds
2
Baths
1,184
Sq Ft
$166/Sq Ft
Est. Value
About This Home
This home is located at 2015 Ravenwind Rd, Houston, TX 77067 and is currently estimated at $196,564, approximately $166 per square foot. 2015 Ravenwind Rd is a home located in Harris County with nearby schools including Joan Link Elementary School, Stelle Claughton Middle School, and Westfield High School.
Ownership History
Date
Name
Owned For
Owner Type
Purchase Details
Closed on
Apr 28, 2010
Sold by
Baez Oscar
Bought by
Baez Marciano and Baez Maria E
Current Estimated Value
Purchase Details
Closed on
Dec 2, 2009
Sold by
Umanzor Diana
Bought by
Baez Oscar
Purchase Details
Closed on
Sep 9, 2003
Sold by
Lacayo Humberto J and Lacayo Mylena
Bought by
Umanzor Diana
Home Financials for this Owner
Home Financials are based on the most recent Mortgage that was taken out on this home.
Original Mortgage
$83,125
Interest Rate
6.22%
Mortgage Type
Stand Alone First
Purchase Details
Closed on
Sep 3, 2003
Sold by
Lacayo Humberto J and Lacayo Mylena
Bought by
Lacayo Humberto J and Lacayo Mylena
Home Financials for this Owner
Home Financials are based on the most recent Mortgage that was taken out on this home.
Original Mortgage
$83,125
Interest Rate
6.22%
Mortgage Type
Stand Alone First
Create a Home Valuation Report for This Property
The Home Valuation Report is an in-depth analysis detailing your home's value as well as a comparison with similar homes in the area
Home Values in the Area
Average Home Value in this Area
Purchase History
| Date | Buyer | Sale Price | Title Company |
|---|---|---|---|
| Baez Marciano | -- | None Available | |
| Baez Oscar | -- | Universal Land Title | |
| Umanzor Diana | -- | Fidelity National Title | |
| Lacayo Humberto J | -- | Fidelity National Title |
Source: Public Records
Mortgage History
| Date | Status | Borrower | Loan Amount |
|---|---|---|---|
| Previous Owner | Umanzor Diana | $83,125 |
Source: Public Records
Tax History Compared to Growth
Tax History
| Year | Tax Paid | Tax Assessment Tax Assessment Total Assessment is a certain percentage of the fair market value that is determined by local assessors to be the total taxable value of land and additions on the property. | Land | Improvement |
|---|---|---|---|---|
| 2025 | $5,039 | $177,016 | $33,945 | $143,071 |
| 2024 | $5,039 | $185,847 | $33,945 | $151,902 |
| 2023 | $5,039 | $185,847 | $33,945 | $151,902 |
| 2022 | $4,748 | $166,686 | $17,408 | $149,278 |
| 2021 | $4,171 | $137,348 | $17,408 | $119,940 |
| 2020 | $4,140 | $123,996 | $17,408 | $106,588 |
| 2019 | $4,225 | $122,842 | $17,408 | $105,434 |
| 2018 | $3,120 | $103,299 | $9,865 | $93,434 |
| 2017 | $3,639 | $103,299 | $9,865 | $93,434 |
| 2016 | $3,366 | $95,535 | $9,865 | $85,670 |
| 2015 | $2,243 | $81,741 | $9,865 | $71,876 |
| 2014 | $2,243 | $61,171 | $9,865 | $51,306 |
Source: Public Records
Map
Nearby Homes
- 2214 Rhyme Court Rd
- 11611 Old Telegraph Rd
- 11326 Snow Bay Dr
- 11622 Old Telegraph Rd
- 2507 W Greens Rd
- 11307 Snow Bay Dr
- 11307 Birdwing Ln
- 2043 Derby Dr
- 2075 Delphi Ln
- 2407 Hazyknoll Ln
- 2503 Hazyknoll Ln
- 11831 Bee Ln
- 12207 Mckamy Dr
- 12114 Mckamy Dr
- 2606 Owens Cross Dr
- 1922 Tomlinson Trail Dr
- 12035 Swords Creek Rd
- 2315 Tomlinson Trail Dr
- 1510 Chestnut Tree Ln
- 2222 Irish Spring Dr
- 2103 Ravenwind Rd
- 2011 Ravenwind Rd
- 2107 Ravenwind Rd
- 2111 Ravenwind Rd
- 11407 Greens Ct
- 2102 W Greens Rd
- 2106 W Greens Rd
- 2014 Ravenwind Rd
- 2102 Ravenwind Rd
- 2007 Ravenwind Rd
- 2010 Ravenwind Rd
- 2110 W Greens Rd
- 2115 Ravenwind Rd
- 2106 Ravenwind Rd
- 11403 Greens Ct
- 11410 Greens Ct
- 2114 W Greens Rd
- 2110 Ravenwind Rd
- 2119 Ravenwind Rd
- 2103 Musket Groves St