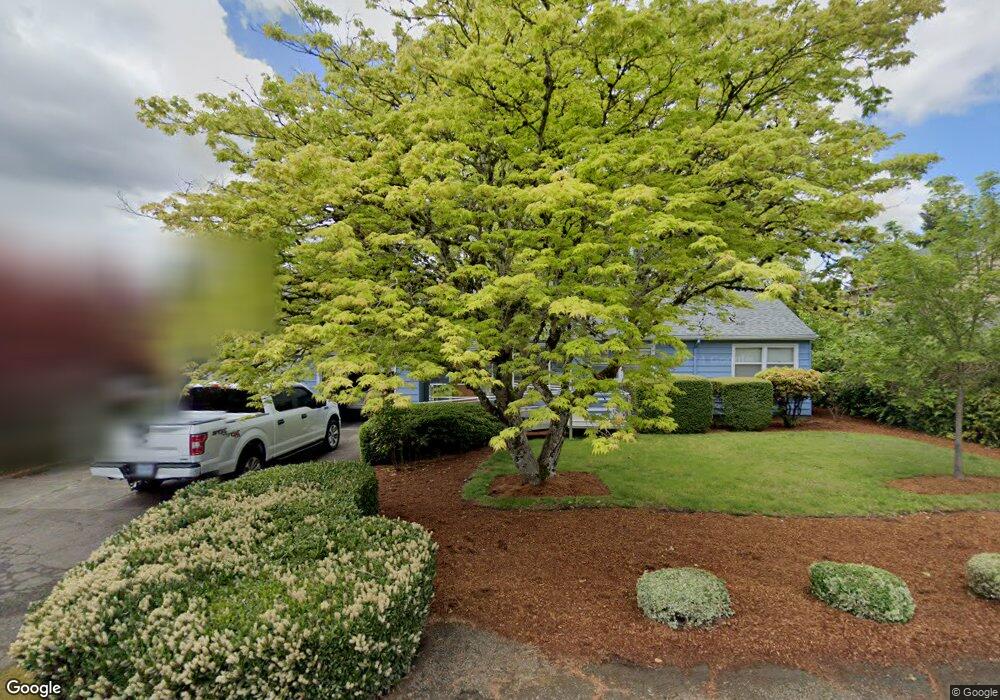
2015 SW McCamley Rd Beaverton, OR 97005
Estimated Value: $524,000 - $579,000
3
Beds
2
Baths
1,317
Sq Ft
$425/Sq Ft
Est. Value
About This Home
This home is located at 2015 SW McCamley Rd, Beaverton, OR 97005 and is currently estimated at $559,691, approximately $424 per square foot. 2015 SW McCamley Rd is a home located in Washington County with nearby schools including Barnes Elementary School, Meadow Park Middle School, and Beaverton High School.
Ownership History
Date
Name
Owned For
Owner Type
Purchase Details
Closed on
Apr 5, 2012
Sold by
Grambo Randy
Bought by
Grambo Development Co Llc
Current Estimated Value
Purchase Details
Closed on
Apr 23, 2004
Sold by
Martyn June I
Bought by
Nicholson Angela M
Home Financials for this Owner
Home Financials are based on the most recent Mortgage that was taken out on this home.
Original Mortgage
$165,700
Interest Rate
4.37%
Mortgage Type
New Conventional
Purchase Details
Closed on
Aug 26, 1997
Sold by
Galimanis Michael R
Bought by
Latwesen Mark and Latwesen Janell L
Purchase Details
Closed on
Oct 2, 1996
Sold by
Martyn Robert A and Martyn June I
Bought by
Martyn June I and June I Martyn 1996 Living Trust
Create a Home Valuation Report for This Property
The Home Valuation Report is an in-depth analysis detailing your home's value as well as a comparison with similar homes in the area
Home Values in the Area
Average Home Value in this Area
Purchase History
| Date | Buyer | Sale Price | Title Company |
|---|---|---|---|
| Grambo Development Co Llc | -- | None Available | |
| Nicholson Angela M | $207,125 | Fidelity Natl Title Co Of Or | |
| Latwesen Mark | $132,000 | Ticor Title Insurance | |
| Martyn June I | -- | -- |
Source: Public Records
Mortgage History
| Date | Status | Borrower | Loan Amount |
|---|---|---|---|
| Previous Owner | Nicholson Angela M | $165,700 | |
| Closed | Nicholson Angela M | $20,712 |
Source: Public Records
Tax History Compared to Growth
Tax History
| Year | Tax Paid | Tax Assessment Tax Assessment Total Assessment is a certain percentage of the fair market value that is determined by local assessors to be the total taxable value of land and additions on the property. | Land | Improvement |
|---|---|---|---|---|
| 2025 | $4,383 | $242,010 | -- | -- |
| 2024 | $4,116 | $234,970 | -- | -- |
| 2023 | $4,116 | $228,130 | $0 | $0 |
| 2022 | $3,982 | $228,130 | $0 | $0 |
| 2021 | $3,839 | $215,040 | $0 | $0 |
| 2020 | $3,723 | $208,780 | $0 | $0 |
| 2019 | $3,602 | $202,700 | $0 | $0 |
| 2018 | $3,484 | $196,800 | $0 | $0 |
| 2017 | $3,359 | $191,070 | $0 | $0 |
| 2016 | $3,239 | $185,510 | $0 | $0 |
| 2015 | $3,114 | $180,110 | $0 | $0 |
| 2014 | $3,051 | $174,870 | $0 | $0 |
Source: Public Records
Map
Nearby Homes
- 13375 SW Glenhaven St
- 12920 SW Douglas St
- 12735 SW Edgewood St
- 1605 SW Filmont Ave
- 2280 SW Briggs Rd
- 13520 SW Devonshire Dr
- 2340 SW Briggs Rd
- 2200 SW 139th Ave
- 2670 SW Edgemoor Ave
- 13955 SW Burlwood St
- 13875 SW Meridian St
- 13905 SW Meridian St Unit 410
- 13865 SW Meridian St Unit 326
- 1865 SW Wellington Ave
- 14139 SW Burlwood Ln
- 14090 SW Burlwood Ln
- 14230 SW Derby St
- 14340 SW Burlwood Ln
- 14323 SW Burlwood Ln
- 1936 SW 144th Ave
- 1985 SW McCamley Rd
- 2055 SW McCamley Rd
- 2030 SW McCamley Rd
- 2085 SW McCamley Rd
- 2060 SW McCamley Rd
- 13445 SW Walker Rd
- 2000 SW McCamley Rd
- 1965 SW McCamley Rd
- 1858 SW Edgewood Ct
- 1970 SW McCamley Rd
- 2080 SW McCamley Rd
- 1842 SW Edgewood Ct
- 1871 SW Edgewood Ct
- 13190 SW Edgewood St
- 2115 SW Wynwood Ave
- 2095 SW Wynwood Ave
- 2075 SW Wynwood Ave
- 13370 SW Walker Rd
- 13340 SW Walker Rd
- 1826 SW Edgewood Ct