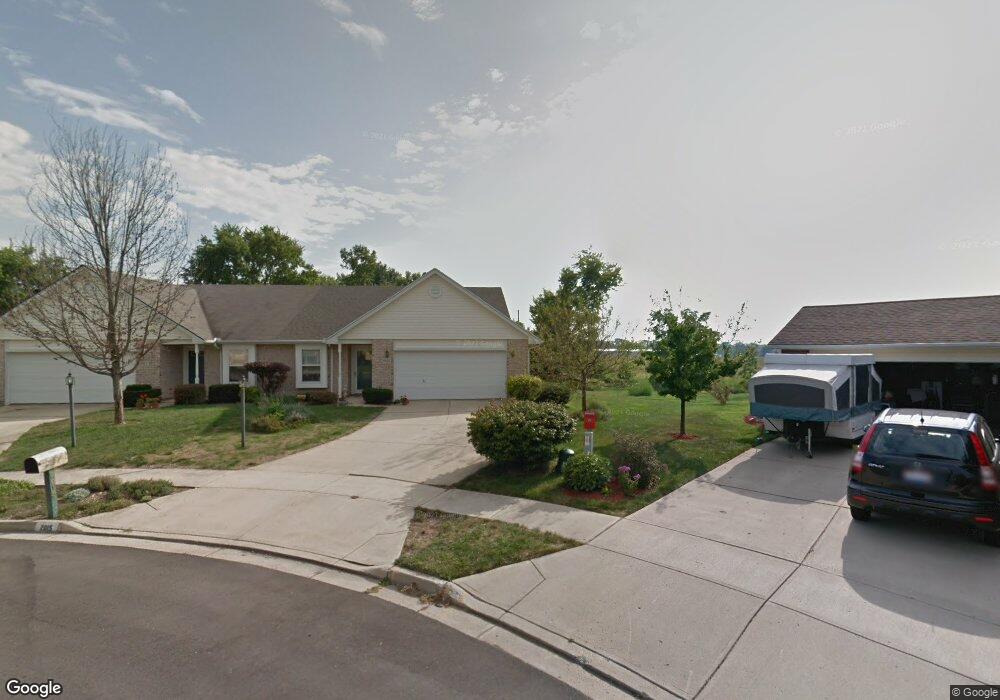
2015 Swallowtail Ct Clayton, OH 45315
Estimated Value: $183,000 - $190,212
2
Beds
2
Baths
1,214
Sq Ft
$152/Sq Ft
Est. Value
About This Home
This home is located at 2015 Swallowtail Ct, Clayton, OH 45315 and is currently estimated at $185,053, approximately $152 per square foot. 2015 Swallowtail Ct is a home located in Montgomery County with nearby schools including Englewood Hills Elementary School, Northmont High School, and Trotwood Preparatory & Fitness Academy.
Ownership History
Date
Name
Owned For
Owner Type
Purchase Details
Closed on
Aug 23, 2021
Sold by
Kimbel Lewis Karen F and Lewis Sherrell
Bought by
Wade Bruce A and Wade Vickie L
Current Estimated Value
Home Financials for this Owner
Home Financials are based on the most recent Mortgage that was taken out on this home.
Original Mortgage
$113,120
Outstanding Balance
$102,706
Interest Rate
2.8%
Mortgage Type
New Conventional
Estimated Equity
$82,347
Purchase Details
Closed on
Sep 8, 2016
Sold by
Speer Robin B
Bought by
Kimbel Karen F and Rohrig David G
Purchase Details
Closed on
Sep 28, 1998
Sold by
Vc-1 Partnership
Bought by
Speer Robin B
Home Financials for this Owner
Home Financials are based on the most recent Mortgage that was taken out on this home.
Original Mortgage
$93,750
Interest Rate
6.98%
Create a Home Valuation Report for This Property
The Home Valuation Report is an in-depth analysis detailing your home's value as well as a comparison with similar homes in the area
Home Values in the Area
Average Home Value in this Area
Purchase History
| Date | Buyer | Sale Price | Title Company |
|---|---|---|---|
| Wade Bruce A | $141,400 | Home Services Title Llc | |
| Kimbel Karen F | $95,000 | Home Services Title Llc | |
| Speer Robin B | $98,800 | -- | |
| Speer Robin B | $98,800 | -- |
Source: Public Records
Mortgage History
| Date | Status | Borrower | Loan Amount |
|---|---|---|---|
| Open | Wade Bruce A | $113,120 | |
| Previous Owner | Speer Robin B | $93,750 |
Source: Public Records
Tax History Compared to Growth
Tax History
| Year | Tax Paid | Tax Assessment Tax Assessment Total Assessment is a certain percentage of the fair market value that is determined by local assessors to be the total taxable value of land and additions on the property. | Land | Improvement |
|---|---|---|---|---|
| 2024 | $2,247 | $48,440 | $12,430 | $36,010 |
| 2023 | $2,247 | $48,440 | $12,430 | $36,010 |
| 2022 | $1,788 | $32,740 | $8,400 | $24,340 |
| 2021 | $2,439 | $32,740 | $8,400 | $24,340 |
| 2020 | $2,393 | $32,740 | $8,400 | $24,340 |
| 2019 | $2,651 | $32,540 | $9,660 | $22,880 |
| 2018 | $2,603 | $32,540 | $9,660 | $22,880 |
| 2017 | $2,585 | $32,540 | $9,660 | $22,880 |
| 2016 | $2,506 | $30,990 | $8,400 | $22,590 |
| 2015 | $2,270 | $30,990 | $8,400 | $22,590 |
| 2014 | $2,270 | $30,990 | $8,400 | $22,590 |
| 2012 | -- | $32,800 | $8,400 | $24,400 |
Source: Public Records
Map
Nearby Homes
- 1976 Swallowtail Ct
- 5077 Crescent Ridge Dr Unit 75077
- 5051 Crescent Ridge Dr Unit 55051
- 5091 Crescent Ridge Dr Unit 95091
- 5117 Crescent Ridge Dr Unit 115117
- 4030 Gateway Dr
- 4329 Gorman Ave
- 918 Sunset Dr
- 817 Southview Dr
- 4751 Valley Brook Dr
- 4734 Rushwood Cir
- 900 Moonlight Dr
- 302 Highland Dr
- 6042 Cinnamon Tree Ct
- 4245 W Wenger Rd
- 0 Hoke Rd Unit 1853211
- 0 Hoke Rd Unit 942335
- 6497 Burkwood Dr
- 6583 Benjamin Franklin Dr
- 6047 Summersweet Dr
- 2017 Swallowtail Ct
- 2013 Swallowtail Ct
- 2016 Swallowtail Ct
- 2011 Swallowtail Ct
- 2009 Swallowtail Ct
- 2014 Swallowtail Ct
- 2012 Swallowtail Ct
- 2010 Swallowtail Ct
- 2007 Swallowtail Ct
- 2008 Swallowtail Ct
- 2005 Swallowtail Ct
- 2006 Swallowtail Ct
- 2003 Swallowtail Ct
- 2004 Swallowtail Ct
- 1026 Meadow Thrush Dr
- 2002 Swallowtail Ct
- 2001 Swallowtail Ct
- 1028 Meadow Thrush Dr
- 1999 Swallowtail Ct
- 1020 Meadow Thrush Dr