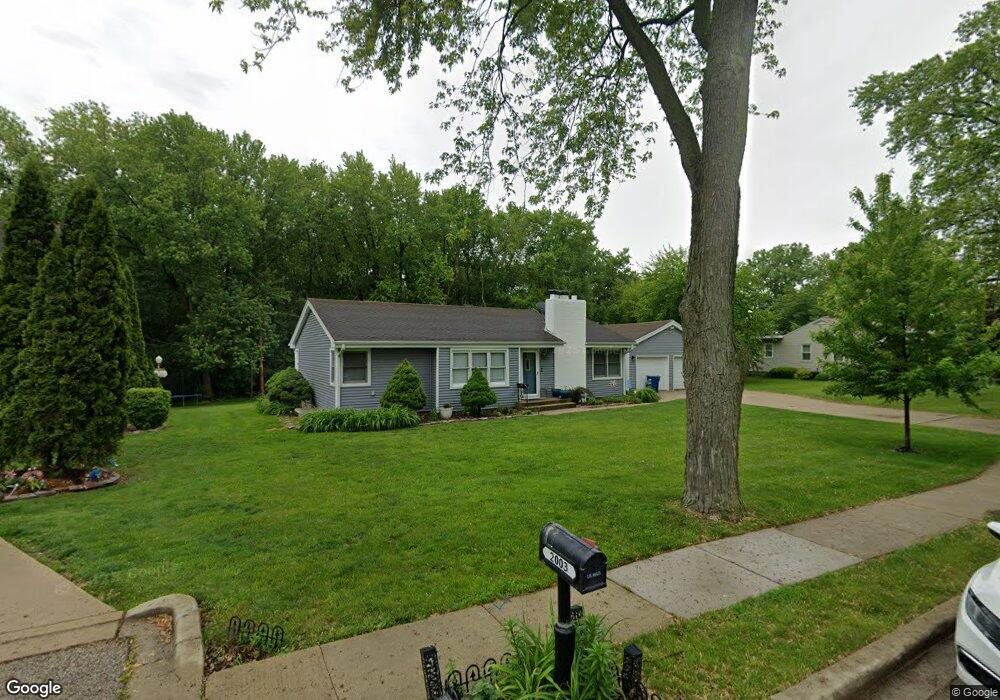
2015 Willow Ave Hanover Park, IL 60133
Estimated Value: $343,000 - $382,000
3
Beds
2
Baths
1,565
Sq Ft
$229/Sq Ft
Est. Value
About This Home
This home is located at 2015 Willow Ave, Hanover Park, IL 60133 and is currently estimated at $357,650, approximately $228 per square foot. 2015 Willow Ave is a home located in Cook County with nearby schools including Ontarioville Elementary School, Tefft Middle School, and Bartlett High School.
Ownership History
Date
Name
Owned For
Owner Type
Purchase Details
Closed on
May 4, 2000
Sold by
Munoz Gonzalo and Munoz Jesus G
Bought by
Munoz Alfredo and Munoz Francisca
Current Estimated Value
Home Financials for this Owner
Home Financials are based on the most recent Mortgage that was taken out on this home.
Original Mortgage
$130,245
Interest Rate
8.66%
Purchase Details
Closed on
Aug 23, 1999
Sold by
Munoz Gonzalo and Munoz Jesus
Bought by
Munoz Alfredo and Munoz Francisca
Purchase Details
Closed on
Jun 22, 1995
Sold by
Esquibel Fred and Esquibel Fred C
Bought by
Munoz Gonzalo and Munoz Jesus G
Home Financials for this Owner
Home Financials are based on the most recent Mortgage that was taken out on this home.
Original Mortgage
$117,000
Interest Rate
7.9%
Create a Home Valuation Report for This Property
The Home Valuation Report is an in-depth analysis detailing your home's value as well as a comparison with similar homes in the area
Home Values in the Area
Average Home Value in this Area
Purchase History
| Date | Buyer | Sale Price | Title Company |
|---|---|---|---|
| Munoz Alfredo | -- | -- | |
| Munoz Alfredo | -- | Djh Title & Abstract | |
| Munoz Gonzalo | $130,000 | -- |
Source: Public Records
Mortgage History
| Date | Status | Borrower | Loan Amount |
|---|---|---|---|
| Closed | Munoz Alfredo | $130,245 | |
| Closed | Munoz Gonzalo | $117,000 | |
| Closed | Munoz Alfredo | $14,500 |
Source: Public Records
Tax History
| Year | Tax Paid | Tax Assessment Tax Assessment Total Assessment is a certain percentage of the fair market value that is determined by local assessors to be the total taxable value of land and additions on the property. | Land | Improvement |
|---|---|---|---|---|
| 2025 | $8,879 | $32,000 | $10,182 | $21,818 |
| 2024 | $8,879 | $28,000 | $8,485 | $19,515 |
| 2023 | $8,649 | $28,000 | $8,485 | $19,515 |
| 2022 | $8,649 | $28,000 | $8,485 | $19,515 |
| 2021 | $7,283 | $19,190 | $5,939 | $13,251 |
| 2020 | $7,224 | $19,190 | $5,939 | $13,251 |
| 2019 | $7,186 | $21,323 | $5,939 | $15,384 |
| 2018 | $8,051 | $21,391 | $5,091 | $16,300 |
| 2017 | $7,973 | $21,391 | $5,091 | $16,300 |
| 2016 | $7,512 | $21,391 | $5,091 | $16,300 |
| 2015 | $7,155 | $18,672 | $4,666 | $14,006 |
| 2014 | $7,014 | $18,672 | $4,666 | $14,006 |
| 2013 | $7,017 | $19,301 | $4,666 | $14,635 |
Source: Public Records
Map
Nearby Homes
- 2110 Cherry Ave
- 6791 Church St
- 6881 Hickory St
- 6540 Lilac Blvd
- 27W607 Devon Ave
- 1672 Evergreen Ave
- 807 Hayward Ave
- 6971 Hanover St
- 7N630 County Farm Rd
- 1634 Oak St
- 1615 Oak St
- 748 Sterling Ct Unit A2
- 1861 Hollywood Ave
- 1723 Mckool Ave
- 805 Stowell Ave
- 745 Candleridge Ct Unit B2
- 6280 Gold Cir Unit 6280
- 1463 Sutter Dr Unit 453
- 1105 Sandpiper Ct
- 1446 Sutter Dr
Your Personal Tour Guide
Ask me questions while you tour the home.