2015 Willow Branch Dr Cape Coral, FL 33991
Trafalgar NeighborhoodEstimated Value: $424,443 - $518,000
5
Beds
4
Baths
3,355
Sq Ft
$139/Sq Ft
Est. Value
About This Home
This home is located at 2015 Willow Branch Dr, Cape Coral, FL 33991 and is currently estimated at $466,361, approximately $139 per square foot. 2015 Willow Branch Dr is a home located in Lee County with nearby schools including Caloosa Elementary School, Tropic Isles Elementary School, and Cape Elementary School.
Ownership History
Date
Name
Owned For
Owner Type
Purchase Details
Closed on
Mar 8, 2022
Sold by
Robert Kuchuk Revocable Trust
Bought by
Kuchuk Phillip
Current Estimated Value
Purchase Details
Closed on
May 7, 2014
Sold by
Puerta Angelina J
Bought by
Kuchuk Robert and Robert Kuchuk Revocable Trust
Purchase Details
Closed on
Sep 4, 2013
Sold by
Us Bank National Association
Bought by
Puerta Angelina J
Purchase Details
Closed on
Jun 18, 2013
Sold by
Contreras Jaime Enrique
Bought by
Us Bank National Association
Purchase Details
Closed on
Jul 29, 2005
Sold by
Beazer Homes Corp
Bought by
Contreras Jaime Enrique and Mendoza Consuelo
Home Financials for this Owner
Home Financials are based on the most recent Mortgage that was taken out on this home.
Original Mortgage
$297,058
Interest Rate
6.79%
Mortgage Type
Fannie Mae Freddie Mac
Purchase Details
Closed on
Nov 12, 2004
Sold by
Heatherwood Lakes Development Co Llc
Bought by
Beazer Homes Corp
Create a Home Valuation Report for This Property
The Home Valuation Report is an in-depth analysis detailing your home's value as well as a comparison with similar homes in the area
Home Values in the Area
Average Home Value in this Area
Purchase History
| Date | Buyer | Sale Price | Title Company |
|---|---|---|---|
| Kuchuk Phillip | -- | None Listed On Document | |
| Kuchuk Robert | $250,000 | Burnt Store Title & Escrow L | |
| Puerta Angelina J | $177,299 | Premium Title Services Inc | |
| Us Bank National Association | $185,100 | None Available | |
| Contreras Jaime Enrique | $371,400 | Lawyers Title Ins | |
| Beazer Homes Corp | $560,000 | -- |
Source: Public Records
Mortgage History
| Date | Status | Borrower | Loan Amount |
|---|---|---|---|
| Previous Owner | Contreras Jaime Enrique | $297,058 |
Source: Public Records
Tax History Compared to Growth
Tax History
| Year | Tax Paid | Tax Assessment Tax Assessment Total Assessment is a certain percentage of the fair market value that is determined by local assessors to be the total taxable value of land and additions on the property. | Land | Improvement |
|---|---|---|---|---|
| 2025 | $6,703 | $392,029 | $66,215 | $321,018 |
| 2024 | $7,420 | $403,171 | $185,861 | $214,113 |
| 2023 | $7,420 | $447,637 | $217,002 | $230,635 |
| 2022 | $5,890 | $288,234 | $0 | $0 |
| 2021 | $5,293 | $262,699 | $32,000 | $230,699 |
| 2020 | $5,023 | $238,210 | $50,000 | $188,210 |
| 2019 | $5,033 | $240,618 | $41,500 | $199,118 |
| 2018 | $4,739 | $218,830 | $41,500 | $177,330 |
| 2017 | $4,655 | $211,565 | $41,500 | $170,065 |
| 2016 | $4,803 | $224,149 | $41,500 | $182,649 |
| 2015 | $4,440 | $194,420 | $35,000 | $159,420 |
| 2014 | $4,101 | $175,305 | $15,000 | $160,305 |
| 2013 | -- | $149,403 | $20,400 | $129,003 |
Source: Public Records
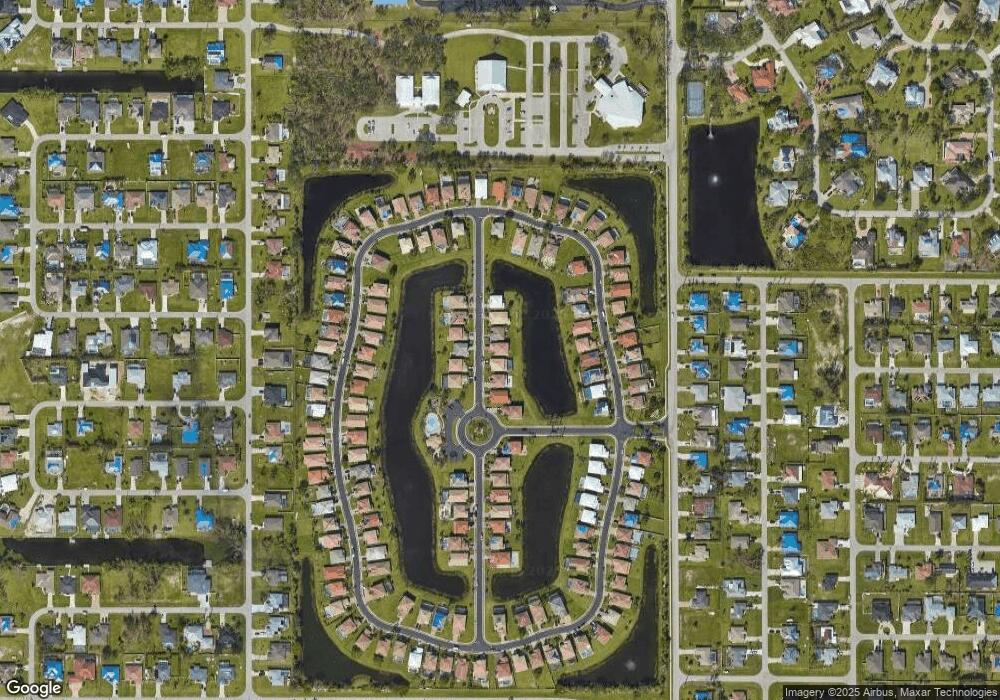
Map
Nearby Homes
- 2060 Cape Heather Cir
- 2088 Cape Heather Cir
- 2073 Cape Heather Cir
- 2117 SW 22nd Ct
- 2013 SW 19th Place
- 2307 SW 21st Terrace
- 2134 SW 22nd Terrace
- 2321 SW 21st Terrace
- 2210 SW 19th Ave
- 1807 SW 21st Ln
- 1817 SW 22nd Terrace
- 1726 SW 21st St
- 1721 SW 21st Ln
- 1806 SW 22nd Terrace
- 1828 SW 18th Terrace
- 2019 SW 17th Place
- 2103 SW 17th Place
- 2309 SW 19th Place
- 2111 SW 17th Place
- 2314 SW 18th St
- 2011 Willow Branch Dr
- 2019 Willow Branch Dr
- 2007 Willow Branch Dr
- 2023 Willow Branch Dr
- 2027 Willow Branch Dr
- 2014 Willow Branch Dr
- 2003 Willow Branch Dr
- 2010 Willow Branch Dr
- 2018 Willow Branch Dr
- 2006 Willow Branch Dr
- 2022 Willow Branch Dr
- 2031 Willow Branch Dr
- 2002 Willow Branch Dr
- 2020 Cape Heather Cir
- 2016 Cape Heather Cir
- 2024 Cape Heather Cir
- 2012 Cape Heather Cir
- 2028 Cape Heather Cir
- 2008 Cape Heather Cir
- 2035 Willow Branch Dr