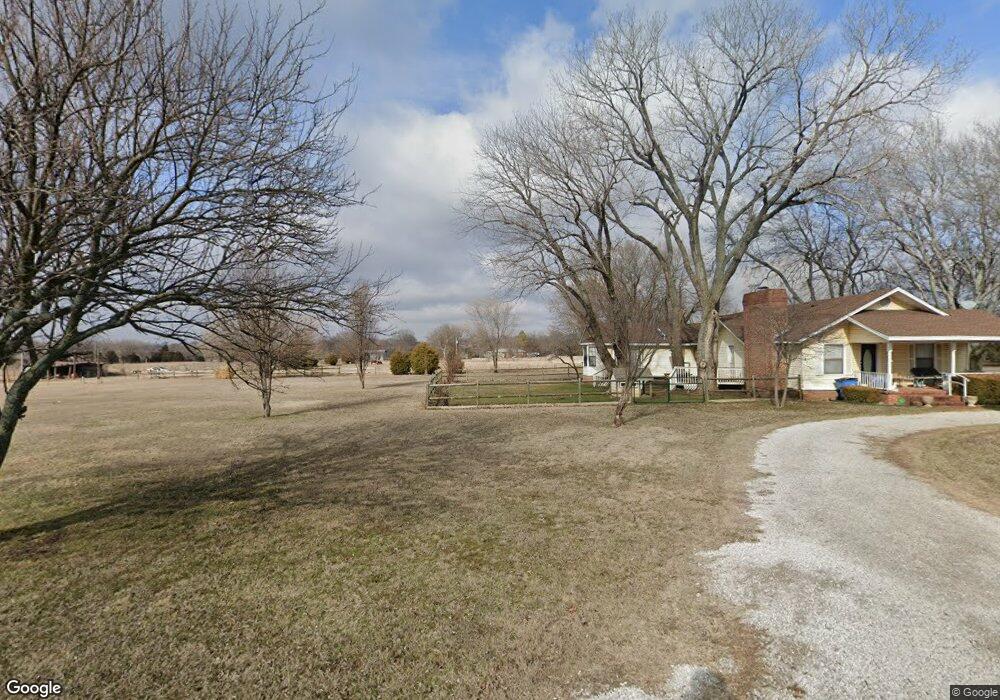
20151 E 106th St N Claremore, OK 74019
Estimated Value: $208,000 - $465,000
4
Beds
3
Baths
2,050
Sq Ft
$170/Sq Ft
Est. Value
About This Home
This home is located at 20151 E 106th St N, Claremore, OK 74019 and is currently estimated at $349,333, approximately $170 per square foot. 20151 E 106th St N is a home located in Rogers County with nearby schools including Sequoyah Elementary School and Sequoyah High School.
Ownership History
Date
Name
Owned For
Owner Type
Purchase Details
Closed on
Jun 6, 2025
Sold by
Pirrone Eric Thomas and Pirrone Jade N
Bought by
Rose Rock Portfolio Llc
Current Estimated Value
Home Financials for this Owner
Home Financials are based on the most recent Mortgage that was taken out on this home.
Original Mortgage
$927,750
Outstanding Balance
$888,460
Interest Rate
6.81%
Mortgage Type
New Conventional
Estimated Equity
-$539,127
Purchase Details
Closed on
Sep 14, 2023
Sold by
Gonzalez Alejandro
Bought by
Pirrone Eric and Pirrone Lade
Purchase Details
Closed on
Mar 27, 2013
Sold by
Teague Susan Elizabeth and Teague Lesley Dean
Bought by
Huckaby Stacey and Gonzalez Alejandro
Home Financials for this Owner
Home Financials are based on the most recent Mortgage that was taken out on this home.
Original Mortgage
$81,000
Interest Rate
3.59%
Mortgage Type
Purchase Money Mortgage
Purchase Details
Closed on
Aug 1, 2011
Sold by
Teague Lesley Dean
Bought by
Teague Susan Elizabeth
Purchase Details
Closed on
Jun 17, 1993
Sold by
Dara Sabah A
Create a Home Valuation Report for This Property
The Home Valuation Report is an in-depth analysis detailing your home's value as well as a comparison with similar homes in the area
Home Values in the Area
Average Home Value in this Area
Purchase History
| Date | Buyer | Sale Price | Title Company |
|---|---|---|---|
| Rose Rock Portfolio Llc | -- | None Listed On Document | |
| Pirrone Eric | $173,000 | First American Title | |
| Huckaby Stacey | $153,000 | None Available | |
| Teague Susan Elizabeth | -- | None Available | |
| -- | $79,500 | -- |
Source: Public Records
Mortgage History
| Date | Status | Borrower | Loan Amount |
|---|---|---|---|
| Open | Rose Rock Portfolio Llc | $927,750 | |
| Previous Owner | Huckaby Stacey | $81,000 |
Source: Public Records
Tax History Compared to Growth
Tax History
| Year | Tax Paid | Tax Assessment Tax Assessment Total Assessment is a certain percentage of the fair market value that is determined by local assessors to be the total taxable value of land and additions on the property. | Land | Improvement |
|---|---|---|---|---|
| 2025 | $2,102 | $18,210 | $5,500 | $12,710 |
| 2024 | $2,102 | $19,046 | $5,500 | $13,546 |
| 2023 | $2,102 | $17,310 | $4,754 | $12,556 |
| 2022 | $1,789 | $16,806 | $4,400 | $12,406 |
| 2021 | $1,813 | $17,193 | $4,400 | $12,793 |
| 2020 | $1,796 | $17,315 | $4,400 | $12,915 |
| 2019 | $1,742 | $16,570 | $4,400 | $12,170 |
| 2018 | $1,777 | $17,413 | $4,400 | $13,013 |
| 2017 | $1,777 | $17,271 | $4,400 | $12,871 |
| 2016 | $1,737 | $16,890 | $4,400 | $12,490 |
| 2015 | $1,746 | $16,870 | $4,400 | $12,470 |
| 2014 | $1,800 | $17,240 | $4,400 | $12,840 |
Source: Public Records
Map
Nearby Homes
- 20005 E Highway 20
- 19184 E Summer Ln
- 21095 E Barbara Blvd
- 19112 E 480 Rd Unit b
- 19112 E 480 Rd Unit B
- 21845 Morgan Rd
- 21870 Morgan Rd
- 19305 S Deer Trail Rd
- 18402 E 480 Rd
- 19854 E 470 Rd
- 19300 S Timber Acres
- 19075 E Timber Trail
- 0 E 470 Rd Unit 2537290
- 25 E 470 Rd
- 426 N 426 Rd
- 22045 S Rocky Ridge Place
- 9050 W 480
- 24205 S 4230 Rd
- 1523 N 426 Rd
- 1825 N 4257 Rd
- 20150 E 106th St N
- 20895 S 4230 Rd
- 20005 E High Way Unit 20
- 20001 E 106th St N
- 20285 E Highway 20
- 21232 S 4230 Rd
- 21230 S 4230 Rd
- 19905 E Brookview Dr
- 20352 E Highway 20
- 21305 S 4230 Rd
- 20797 S 4230 Rd
- 20405 E Highway 20
- 20727 S 4230 Rd
- 19905 Oklahoma 20
- 20705 S 4230 Rd
- 19861 E 106th St N
- 20501 E 106th St N
- 20625 S 4230 Rd
- 20311 E Highway 20
- 0 E State Hwy 20 Hwy Unit 1744983