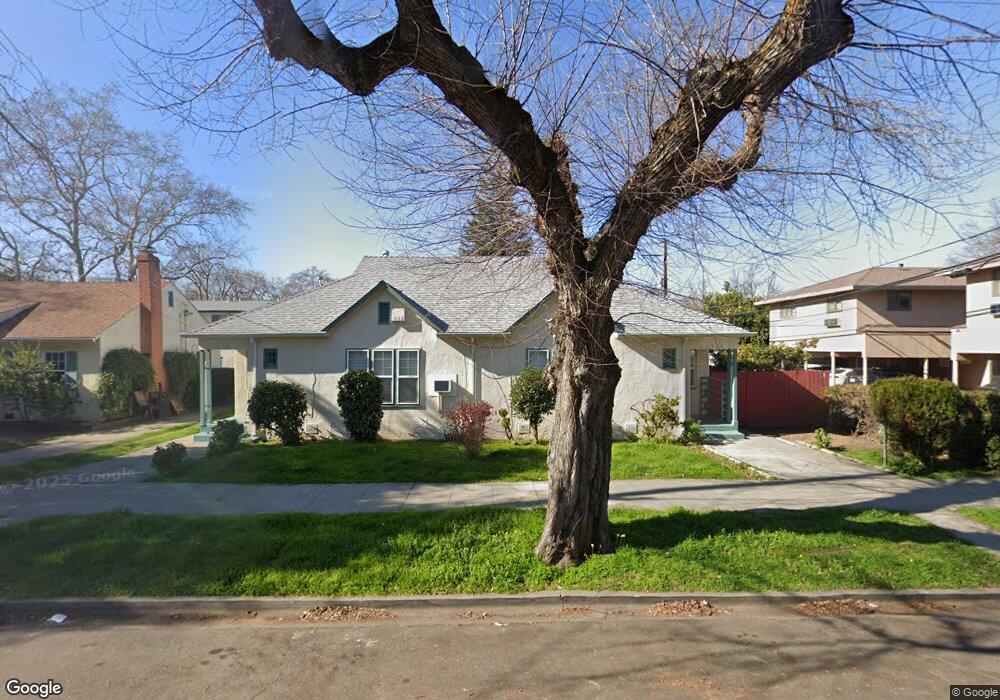
2016 17th St Sacramento, CA 95818
Richmond Grove NeighborhoodEstimated Value: $392,000 - $681,660
2
Beds
3
Baths
1,940
Sq Ft
$296/Sq Ft
Est. Value
About This Home
This home is located at 2016 17th St, Sacramento, CA 95818 and is currently estimated at $574,415, approximately $296 per square foot. 2016 17th St is a home located in Sacramento County with nearby schools including William Land Elementary School, Miwok Middle School, and C. K. McClatchy High.
Ownership History
Date
Name
Owned For
Owner Type
Purchase Details
Closed on
Jul 26, 2025
Sold by
Duong Kevin Quyen and Truong Wendy
Bought by
Kevin Quyen Duong And Wendy Truong Revocable and Duong
Current Estimated Value
Purchase Details
Closed on
Oct 30, 1996
Sold by
Esterino Lombardo Family Trust and Margaret M
Bought by
Duong Kevin and Duong Wendy
Home Financials for this Owner
Home Financials are based on the most recent Mortgage that was taken out on this home.
Original Mortgage
$64,000
Interest Rate
8.14%
Create a Home Valuation Report for This Property
The Home Valuation Report is an in-depth analysis detailing your home's value as well as a comparison with similar homes in the area
Home Values in the Area
Average Home Value in this Area
Purchase History
We collect this data history from publicly available records. To have your information removed, we recommend requesting removal directly through your county’s website.
| Date | Buyer | Sale Price | Title Company |
|---|---|---|---|
| Kevin Quyen Duong And Wendy Truong Revocable | -- | None Listed On Document | |
| Duong Kevin Quyen | -- | None Listed On Document | |
| Duong Kevin Quyen | -- | None Listed On Document | |
| Duong Kevin | $104,000 | Fidelity National Title Co |
Source: Public Records
Mortgage History
We collect this data history from publicly available records. To have your information removed, we recommend requesting removal directly through your county’s website.
| Date | Status | Borrower | Loan Amount |
|---|---|---|---|
| Previous Owner | Duong Kevin | $64,000 |
Source: Public Records
Tax History
| Year | Tax Paid | Tax Assessment Tax Assessment Total Assessment is a certain percentage of the fair market value that is determined by local assessors to be the total taxable value of land and additions on the property. | Land | Improvement |
|---|---|---|---|---|
| 2025 | $2,741 | $211,172 | $65,132 | $146,040 |
| 2024 | $2,741 | $207,032 | $63,855 | $143,177 |
| 2023 | $2,678 | $202,973 | $62,603 | $140,370 |
| 2022 | $2,632 | $198,994 | $61,376 | $137,618 |
| 2021 | $2,514 | $195,093 | $60,173 | $134,920 |
| 2020 | $2,529 | $193,093 | $59,556 | $133,537 |
| 2019 | $2,477 | $189,308 | $58,389 | $130,919 |
| 2018 | $2,415 | $185,597 | $57,245 | $128,352 |
| 2017 | $2,382 | $181,959 | $56,123 | $125,836 |
| 2016 | $2,303 | $178,392 | $55,023 | $123,369 |
| 2015 | $2,270 | $175,713 | $54,197 | $121,516 |
| 2014 | $2,215 | $172,272 | $53,136 | $119,136 |
Source: Public Records
Map
Nearby Homes
Your Personal Tour Guide
Ask me questions while you tour the home.