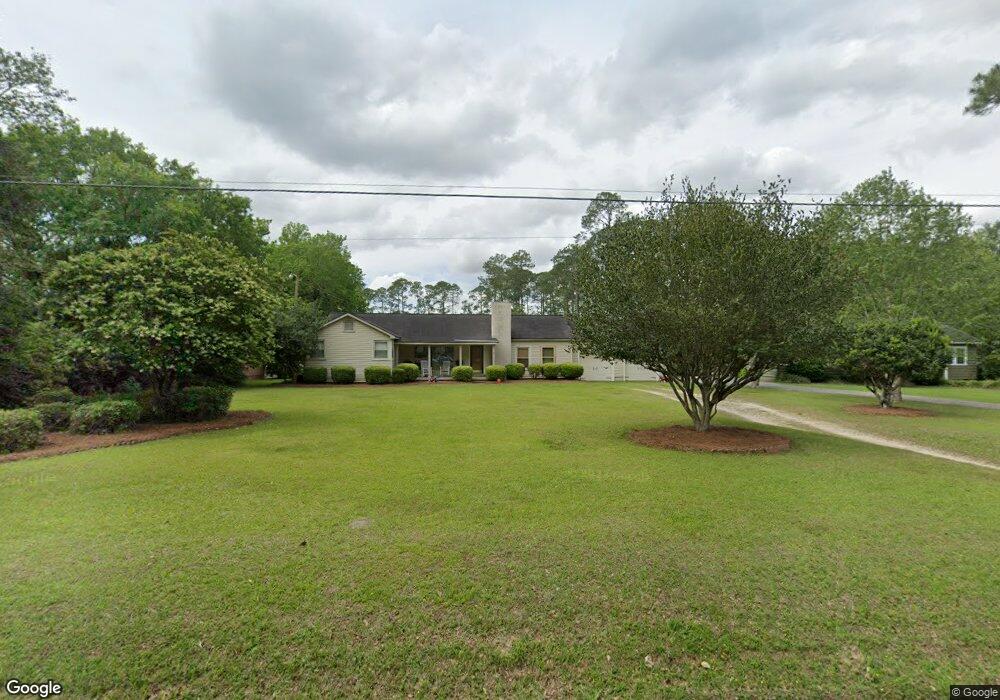
2016 2nd St SE Moultrie, GA 31768
Estimated Value: $217,000 - $244,000
--
Bed
2
Baths
1,683
Sq Ft
$137/Sq Ft
Est. Value
About This Home
This home is located at 2016 2nd St SE, Moultrie, GA 31768 and is currently estimated at $230,582, approximately $137 per square foot. 2016 2nd St SE is a home located in Colquitt County with nearby schools including Wright Elementary School, Willie J. Williams Middle School, and C.A. Gray Junior High School.
Ownership History
Date
Name
Owned For
Owner Type
Purchase Details
Closed on
May 2, 2022
Sold by
Second Street Partners Grp Llc
Bought by
Devane James Mason and Demott Karson Brooke
Current Estimated Value
Home Financials for this Owner
Home Financials are based on the most recent Mortgage that was taken out on this home.
Original Mortgage
$165,000
Outstanding Balance
$155,106
Interest Rate
4.16%
Mortgage Type
New Conventional
Estimated Equity
$75,476
Purchase Details
Closed on
Feb 10, 2015
Sold by
Tomlinson Patricia Rose
Bought by
Second Street Partners Grp Llc
Home Financials for this Owner
Home Financials are based on the most recent Mortgage that was taken out on this home.
Original Mortgage
$83,285
Interest Rate
3.75%
Mortgage Type
New Conventional
Purchase Details
Closed on
Aug 1, 1985
Bought by
Tomlinson Patricia R
Create a Home Valuation Report for This Property
The Home Valuation Report is an in-depth analysis detailing your home's value as well as a comparison with similar homes in the area
Home Values in the Area
Average Home Value in this Area
Purchase History
| Date | Buyer | Sale Price | Title Company |
|---|---|---|---|
| Devane James Mason | $175,000 | -- | |
| Second Street Partners Grp Llc | $90,000 | -- | |
| Tomlinson Patricia R | -- | -- |
Source: Public Records
Mortgage History
| Date | Status | Borrower | Loan Amount |
|---|---|---|---|
| Open | Devane James Mason | $165,000 | |
| Previous Owner | Second Street Partners Grp Llc | $83,285 |
Source: Public Records
Tax History Compared to Growth
Tax History
| Year | Tax Paid | Tax Assessment Tax Assessment Total Assessment is a certain percentage of the fair market value that is determined by local assessors to be the total taxable value of land and additions on the property. | Land | Improvement |
|---|---|---|---|---|
| 2024 | $2,531 | $82,612 | $4,311 | $78,301 |
| 2023 | $2,494 | $65,133 | $4,311 | $60,822 |
| 2022 | $1,691 | $50,521 | $4,311 | $46,210 |
| 2021 | $1,566 | $46,169 | $4,311 | $41,858 |
| 2020 | $1,371 | $39,751 | $4,311 | $35,440 |
| 2019 | $1,452 | $37,417 | $4,311 | $33,106 |
| 2018 | $1,494 | $37,417 | $4,311 | $33,106 |
| 2017 | $1,437 | $37,417 | $4,311 | $33,106 |
| 2016 | $1,438 | $37,417 | $4,311 | $33,106 |
| 2015 | $1,398 | $37,417 | $4,311 | $33,106 |
| 2014 | $1,431 | $36,269 | $4,311 | $31,958 |
| 2013 | -- | $36,268 | $4,311 | $31,957 |
Source: Public Records
Map
Nearby Homes
- 2021 S Main St
- 0 Georgia 33
- 1941 S Main St
- 1935 4th St SE
- 1904 5th St SE
- 204 Nandina Dr
- 304 Tallokas Rd
- M041 5th St SE
- 1777 S Main St
- 1712 Villa Dr SW
- 29 17th Ave SE
- 1732 4th St SE
- 1701 10th St SE
- 1546 Ivy Ln
- 210 13th Ave SE
- 0 26th Ave SE
- 0 Gatewood Cir Unit 1652303
- 1310 S Main St
- 7 SE Pheasant Ln
- 905 Barbara Cir