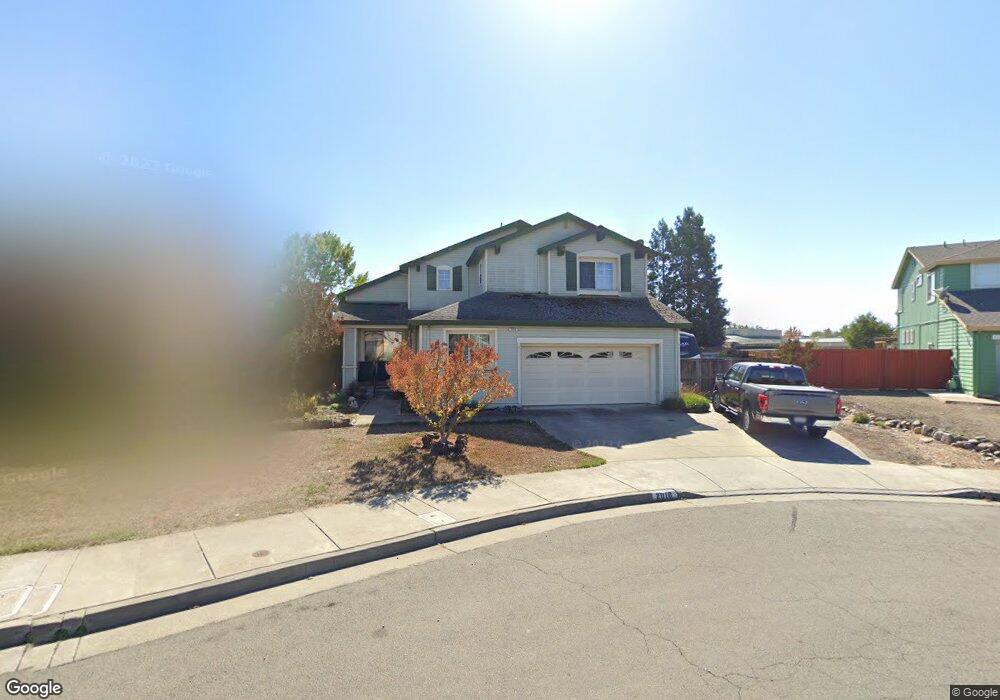
2016 Banjo Dr Santa Rosa, CA 95407
Estimated Value: $697,413 - $824,000
4
Beds
3
Baths
2,206
Sq Ft
$342/Sq Ft
Est. Value
About This Home
This home is located at 2016 Banjo Dr, Santa Rosa, CA 95407 and is currently estimated at $753,353, approximately $341 per square foot. 2016 Banjo Dr is a home located in Sonoma County with nearby schools including Elsie Allen High School and St. Michael's Orthodox School.
Ownership History
Date
Name
Owned For
Owner Type
Purchase Details
Closed on
Feb 12, 2003
Sold by
Porter Guy Michael and Porter Jeanne Marie
Bought by
Porter Guy M and Porter Jeanne M
Current Estimated Value
Home Financials for this Owner
Home Financials are based on the most recent Mortgage that was taken out on this home.
Original Mortgage
$138,500
Interest Rate
5.89%
Purchase Details
Closed on
Mar 21, 2002
Sold by
Porter Guy M and Porter Jeanne M
Bought by
Porter Guy M and Porter Jeanne M
Purchase Details
Closed on
May 29, 1998
Sold by
Bellevue Ranch Associates Llc
Bought by
Porter Guy M and Porter Jeanne M
Home Financials for this Owner
Home Financials are based on the most recent Mortgage that was taken out on this home.
Original Mortgage
$181,600
Interest Rate
7.1%
Create a Home Valuation Report for This Property
The Home Valuation Report is an in-depth analysis detailing your home's value as well as a comparison with similar homes in the area
Purchase History
We collect this data history from publicly available records. To have your information removed, we recommend requesting removal directly through your county’s website.
| Date | Buyer | Sale Price | Title Company |
|---|---|---|---|
| Porter Guy M | -- | First American Title Co | |
| Porter Guy Michael | -- | First American Title Co | |
| Porter Guy M | -- | -- | |
| Porter Guy M | $227,500 | North American Title Co |
Source: Public Records
Mortgage History
We collect this data history from publicly available records. To have your information removed, we recommend requesting removal directly through your county’s website.
| Date | Status | Borrower | Loan Amount |
|---|---|---|---|
| Closed | Porter Guy Michael | $138,500 | |
| Closed | Porter Guy M | $181,600 |
Source: Public Records
Tax History
| Year | Tax Paid | Tax Assessment Tax Assessment Total Assessment is a certain percentage of the fair market value that is determined by local assessors to be the total taxable value of land and additions on the property. | Land | Improvement |
|---|---|---|---|---|
| 2025 | $4,175 | $362,441 | $111,762 | $250,679 |
| 2024 | $4,125 | $355,335 | $109,571 | $245,764 |
| 2023 | $4,125 | $348,369 | $107,423 | $240,946 |
| 2022 | $4,023 | $341,539 | $105,317 | $236,222 |
| 2021 | $3,978 | $334,843 | $103,252 | $231,591 |
| 2020 | $3,864 | $331,411 | $102,194 | $229,217 |
| 2019 | $3,815 | $324,914 | $100,191 | $224,723 |
| 2018 | $3,782 | $318,544 | $98,227 | $220,317 |
| 2017 | $3,690 | $312,299 | $96,301 | $215,998 |
| 2016 | $3,639 | $306,176 | $94,413 | $211,763 |
| 2015 | $3,524 | $301,578 | $92,995 | $208,583 |
| 2014 | $3,400 | $295,672 | $91,174 | $204,498 |
Source: Public Records
Map
Nearby Homes
- 2803 Dutton Meadow
- 2896 Blacktail St
- 2974 Dutton Meadow
- 1960 Barndance Ln
- 2652 Amora Cir
- 671 Bellevue Ave
- 2770 Sassy St
- 2923 Dall Sheep Ln
- 2904 Bertman St
- 2912 Bertman St
- 2786 Sassy St
- 1605 Hearn Ave
- 2751 Bella Cir
- 1438 Trombetta St
- 2513 Edgewater Dr
- 2512 Covelline St
- 1463 Trombetta St
- 1281 Trombetta St
- 921 Naify Ln
- 465 Miaterra Dr
- 2008 Banjo Dr
- 2012 Banjo Dr
- 2004 Banjo Dr
- 2000 Banjo Dr
- 2009 Banjo Dr
- 2013 Banjo Dr
- 2018 Burgess Dr
- 2014 Burgess Dr
- 2022 Burgess Dr
- 2005 Banjo Dr
- 2010 Burgess Dr
- 2026 Burgess Dr
- 2017 Banjo Dr
- 2006 Burgess Dr
- 2619 Rain Dance Way
- 2020 Banjo Dr
- 2002 Burgess Dr
- 2024 Banjo Dr
- 2015 Applejack Way
- 2021 Banjo Dr
Your Personal Tour Guide
Ask me questions while you tour the home.