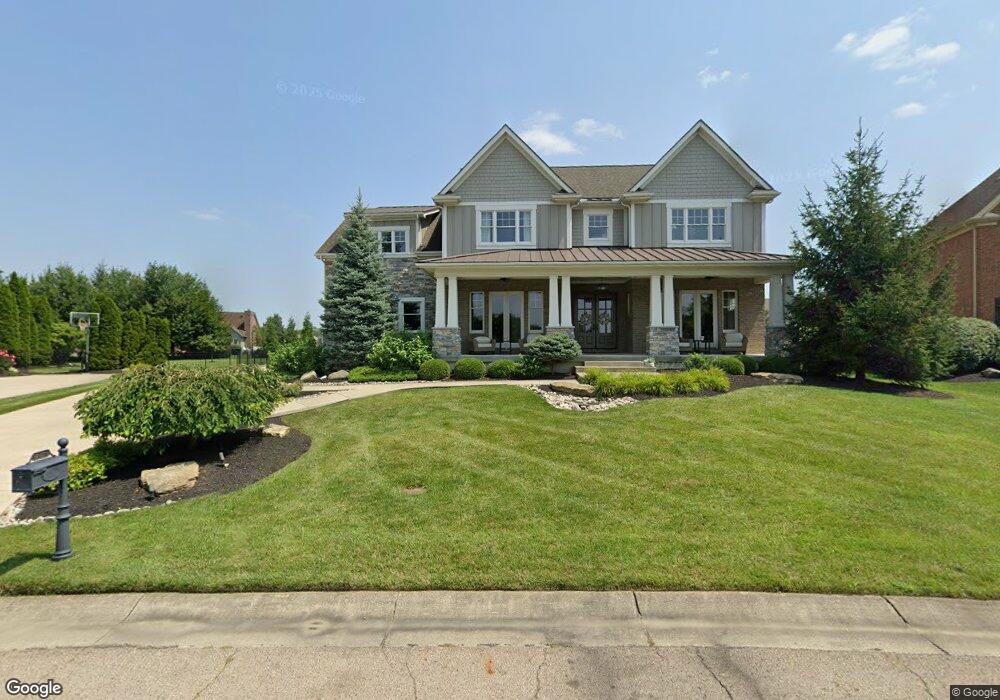
2016 Champions Crossing Dayton, OH 45458
Estimated Value: $1,035,000 - $1,116,000
4
Beds
5
Baths
5,825
Sq Ft
$187/Sq Ft
Est. Value
About This Home
This home is located at 2016 Champions Crossing, Dayton, OH 45458 and is currently estimated at $1,088,074, approximately $186 per square foot. 2016 Champions Crossing is a home located in Montgomery County with nearby schools including Primary Village South, Cline Elementary, and Tower Heights Middle School.
Ownership History
Date
Name
Owned For
Owner Type
Purchase Details
Closed on
Sep 11, 2023
Sold by
Jones Angela and Maiden Dunaway
Bought by
Jones Curran L and Jones Angela
Current Estimated Value
Home Financials for this Owner
Home Financials are based on the most recent Mortgage that was taken out on this home.
Original Mortgage
$697,275
Outstanding Balance
$682,843
Interest Rate
7.09%
Mortgage Type
Credit Line Revolving
Estimated Equity
$405,231
Purchase Details
Closed on
Apr 10, 2017
Sold by
Jones Curran Lyle
Bought by
Jones Angela and Jones Dunaway
Purchase Details
Closed on
Mar 25, 2016
Sold by
Design Homes & Development Co
Bought by
Jones Curran
Home Financials for this Owner
Home Financials are based on the most recent Mortgage that was taken out on this home.
Original Mortgage
$600,000
Interest Rate
3.12%
Mortgage Type
Adjustable Rate Mortgage/ARM
Purchase Details
Closed on
Sep 21, 2012
Sold by
Peebles Homes Llc
Bought by
Design Homes & Development Co
Purchase Details
Closed on
Aug 19, 2009
Sold by
Tom Peebles Builders Llc
Bought by
Peebles Homes Llc
Create a Home Valuation Report for This Property
The Home Valuation Report is an in-depth analysis detailing your home's value as well as a comparison with similar homes in the area
Home Values in the Area
Average Home Value in this Area
Purchase History
| Date | Buyer | Sale Price | Title Company |
|---|---|---|---|
| Jones Curran L | -- | 20/20 Title | |
| Jones Angela | -- | None Available | |
| Jones Curran | $750,000 | Sterling Title Llc | |
| Design Homes & Development Co | $40,000 | None Available | |
| Peebles Homes Llc | -- | Attorney |
Source: Public Records
Mortgage History
| Date | Status | Borrower | Loan Amount |
|---|---|---|---|
| Open | Jones Curran L | $697,275 | |
| Previous Owner | Jones Curran | $600,000 |
Source: Public Records
Tax History Compared to Growth
Tax History
| Year | Tax Paid | Tax Assessment Tax Assessment Total Assessment is a certain percentage of the fair market value that is determined by local assessors to be the total taxable value of land and additions on the property. | Land | Improvement |
|---|---|---|---|---|
| 2024 | $20,137 | $327,500 | $23,720 | $303,780 |
| 2023 | $20,137 | $327,500 | $23,720 | $303,780 |
| 2022 | $20,523 | $264,110 | $19,130 | $244,980 |
| 2021 | $20,580 | $264,110 | $19,130 | $244,980 |
| 2020 | $20,551 | $264,110 | $19,130 | $244,980 |
| 2019 | $20,120 | $231,060 | $22,000 | $209,060 |
| 2018 | $17,965 | $231,060 | $22,000 | $209,060 |
| 2017 | $18,196 | $231,060 | $22,000 | $209,060 |
| 2016 | $17,250 | $206,480 | $19,130 | $187,350 |
| 2015 | $1,574 | $206,480 | $19,130 | $187,350 |
| 2014 | $1,574 | $19,130 | $19,130 | $0 |
| 2012 | -- | $35,110 | $35,110 | $0 |
Source: Public Records
Map
Nearby Homes
- 2037 Stablehand Dr
- 9354 Buckboard Dr
- 9266 Ridings Blvd
- 1947 Horseshoe Bend
- 1943 Horseshoe Bend
- 9882 Saddle Creek Trail
- 0 Rooks Rd
- 1890 Horseshoe Bend
- 1886 Horseshoe Bend
- 9101 Rooks Rd
- 9424 Clyo Rd
- 9850 Fairwater Springs Dr
- 9038 Woodstream Ln
- 9863 Fairwater Springs Dr
- 2044 Meadowside Ln
- 9214 N Creek Ln
- 2006 Washington Creek Ln
- 2780 E Spring Valley Pike
- 1332 Clydesdale Ct
- 9139 Indian Springs Ct
- 2024 Champions Crossing
- 2008 Champions Crossing
- 2041 Stablehand Dr
- 2000 Champions Crossing
- 2031 Stablehand Dr
- Lot 45 Stablehand
- 2061 Stablehand Dr
- 2001 Stablehand Dr
- 2036 Stablehand Dr
- 2036 Stablehand Dr Unit LOT45
- 2013 Stablehand Dr
- 2042 Stablehand Dr
- 2030 Stablehand Dr
- 2054 Stablehand Dr
- 9350 Buckboard Dr
- 2048 Stablehand Dr
- 2070 Stablehand Dr
- 9342 Buckboard Dr
- 2060 Stablehand Dr
- 64 Saddlecreek Trail