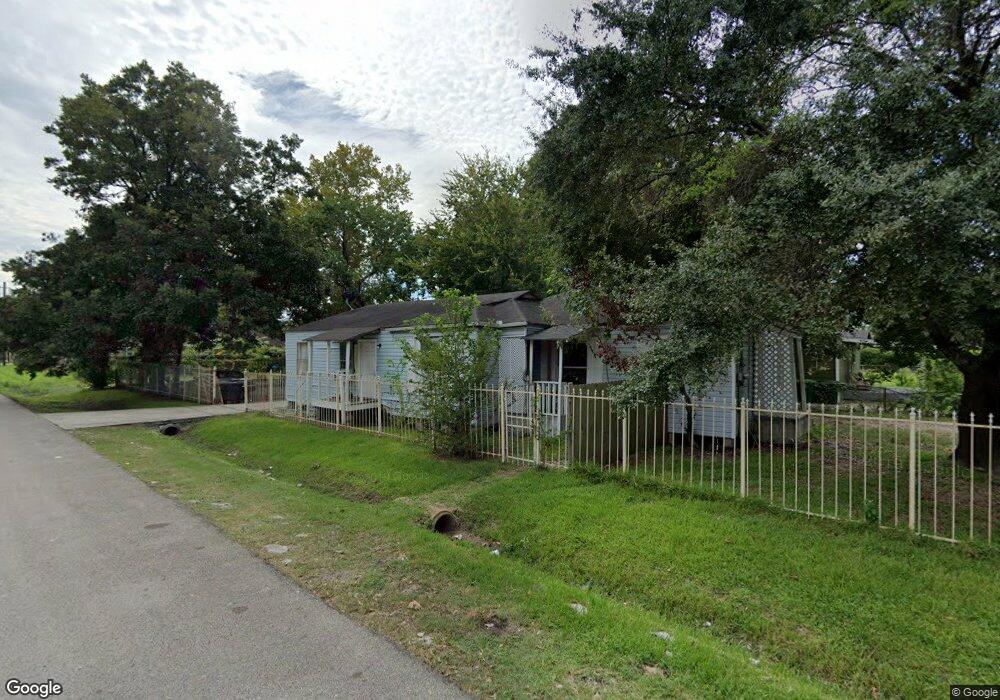
2016 Creston Dr Unit 2 Houston, TX 77026
Eastex-Jensen NeighborhoodEstimated Value: $166,000 - $226,000
4
Beds
2
Baths
1,592
Sq Ft
$122/Sq Ft
Est. Value
About This Home
This home is located at 2016 Creston Dr Unit 2, Houston, TX 77026 and is currently estimated at $193,669, approximately $121 per square foot. 2016 Creston Dr Unit 2 is a home located in Harris County with nearby schools including Ross Elementary School, Key Middle, and Northside High School.
Ownership History
Date
Name
Owned For
Owner Type
Purchase Details
Closed on
Jun 3, 2021
Sold by
Ceballos Hank R
Bought by
Andante Properties Llc
Current Estimated Value
Home Financials for this Owner
Home Financials are based on the most recent Mortgage that was taken out on this home.
Original Mortgage
$90,000
Outstanding Balance
$81,484
Interest Rate
2.9%
Mortgage Type
New Conventional
Estimated Equity
$112,185
Purchase Details
Closed on
May 22, 2018
Sold by
Ceballos Hank R and Lerma Luis G
Bought by
Ceballos Hank R and Lerma Vanessa
Purchase Details
Closed on
Apr 28, 2016
Sold by
Beneficial Financial I Inc
Bought by
Ceballos Hank and Lerma Luis G
Purchase Details
Closed on
Feb 3, 2015
Sold by
Henderson Walter
Bought by
Beneficial Financial 1 Inc
Purchase Details
Closed on
Jul 21, 2006
Sold by
Henderson Walter
Bought by
Dotson Horace
Create a Home Valuation Report for This Property
The Home Valuation Report is an in-depth analysis detailing your home's value as well as a comparison with similar homes in the area
Home Values in the Area
Average Home Value in this Area
Purchase History
| Date | Buyer | Sale Price | Title Company |
|---|---|---|---|
| Andante Properties Llc | -- | None Listed On Document | |
| Andante Properties Llc | -- | None Listed On Document | |
| Ceballos Hank R | -- | None Available | |
| Ceballos Hank | -- | None Available | |
| Beneficial Financial 1 Inc | $29,974 | None Available | |
| Dotson Horace | -- | None Available |
Source: Public Records
Mortgage History
| Date | Status | Borrower | Loan Amount |
|---|---|---|---|
| Open | Andante Properties Llc | $90,000 | |
| Closed | Andante Properties Llc | $90,000 |
Source: Public Records
Tax History Compared to Growth
Tax History
| Year | Tax Paid | Tax Assessment Tax Assessment Total Assessment is a certain percentage of the fair market value that is determined by local assessors to be the total taxable value of land and additions on the property. | Land | Improvement |
|---|---|---|---|---|
| 2025 | $3,662 | $175,900 | $70,725 | $105,175 |
| 2024 | $3,662 | $175,000 | $77,625 | $97,375 |
| 2023 | $3,662 | $175,000 | $77,625 | $97,375 |
| 2022 | $3,408 | $120,000 | $51,750 | $68,250 |
| 2021 | $3,051 | $130,903 | $51,750 | $79,153 |
| 2020 | $2,678 | $110,574 | $27,600 | $82,974 |
| 2019 | $2,843 | $112,371 | $27,600 | $84,771 |
| 2018 | $1,736 | $68,610 | $15,525 | $53,085 |
| 2017 | $1,735 | $68,610 | $15,525 | $53,085 |
| 2016 | $1,940 | $76,718 | $19,500 | $57,218 |
| 2015 | $1,558 | $69,525 | $11,700 | $57,825 |
| 2014 | $1,558 | $58,336 | $7,800 | $50,536 |
Source: Public Records
Map
Nearby Homes
- 2015 Creston Dr
- 2301 King St
- 2402 Bennington St
- 6201 Batterson St
- 6209 Gold St
- 2301 Caplin St
- 2513 Melbourne St
- 2707 Lynnfield St
- 2710 Lynnfield St
- 2716 Spence St
- 2720 Spence St
- 4008 Bennington St
- 6501 Frisco St
- 6505 Frisco St
- 2610 Vance St
- 7307 Adelbert St
- 2410 Vaughn St Unit F
- 2410 Vaughn St Unit B
- 3016 King St
- 2516 Vaughn St
- 2016 Creston Dr Unit 1
- 2016 Creston Dr Unit A
- 2016 Creston Dr #1
- 2055 Creston Dr
- 2000 Creston Dr
- 2100 Creston Dr
- 1916 Creston Dr
- 2116 Creston Dr
- 0 Creston Dr
- 1914 Creston Dr
- 2015 King St
- 2001 Creston Dr
- 2011 King St
- 2101 Creston Dr
- 6402 Batterson St
- 1912 Creston Dr
- 2122 Creston Dr
- 1917 Creston Dr
- 2003 King St
- 1913 Creston Dr