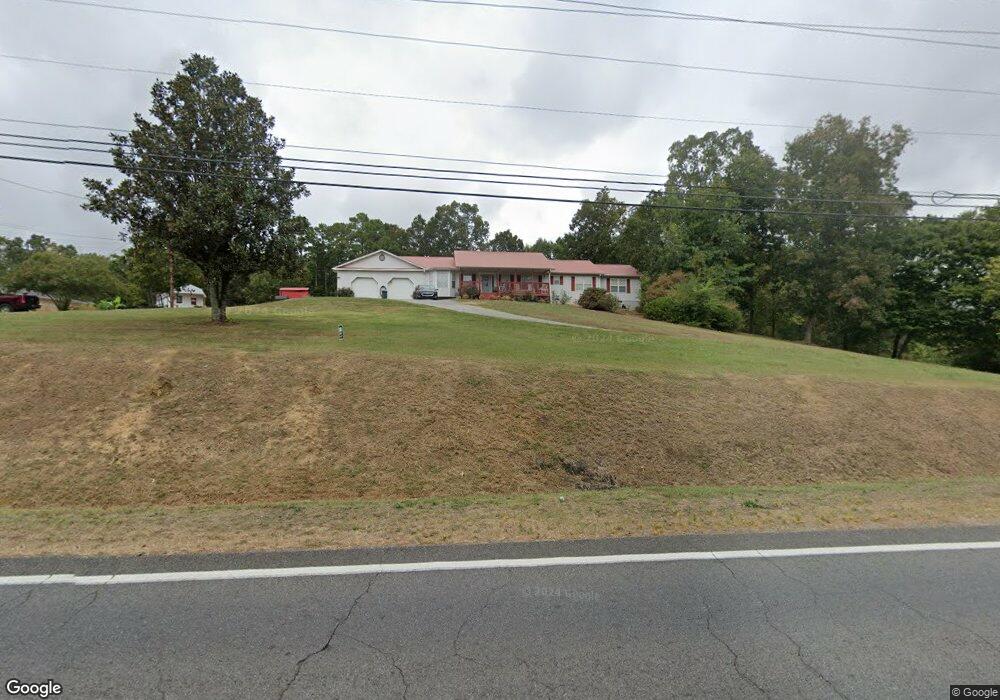
2016 Dews Pond Rd NE Calhoun, GA 30701
Estimated Value: $306,000 - $363,000
3
Beds
2
Baths
1,996
Sq Ft
$169/Sq Ft
Est. Value
About This Home
This home is located at 2016 Dews Pond Rd NE, Calhoun, GA 30701 and is currently estimated at $336,977, approximately $168 per square foot. 2016 Dews Pond Rd NE is a home located in Gordon County with nearby schools including Red Bud Elementary School.
Ownership History
Date
Name
Owned For
Owner Type
Purchase Details
Closed on
Jul 14, 2021
Sold by
Mann Gloria D
Bought by
Bryant Ricky D
Current Estimated Value
Purchase Details
Closed on
Aug 6, 2009
Sold by
Rigney Kam L
Bought by
Rigney Eric
Purchase Details
Closed on
Apr 6, 1999
Bought by
Kigney Eric and Kigney Kam
Purchase Details
Closed on
Jan 20, 1999
Bought by
Baker Phillip M and Baker Lori A
Purchase Details
Closed on
Mar 20, 1996
Bought by
Kellett Lori A
Purchase Details
Closed on
Aug 30, 1994
Bought by
Knight Dale E
Purchase Details
Closed on
Dec 10, 1992
Bought by
Little Allen L and Little Judy L
Create a Home Valuation Report for This Property
The Home Valuation Report is an in-depth analysis detailing your home's value as well as a comparison with similar homes in the area
Home Values in the Area
Average Home Value in this Area
Purchase History
| Date | Buyer | Sale Price | Title Company |
|---|---|---|---|
| Bryant Ricky D | -- | -- | |
| Rigney Eric | $22,000 | -- | |
| Kigney Eric | $113,000 | -- | |
| Baker Phillip M | -- | -- | |
| Kellett Lori A | $93,000 | -- | |
| Knight Dale E | $89,900 | -- | |
| Little Allen L | $74,000 | -- |
Source: Public Records
Tax History Compared to Growth
Tax History
| Year | Tax Paid | Tax Assessment Tax Assessment Total Assessment is a certain percentage of the fair market value that is determined by local assessors to be the total taxable value of land and additions on the property. | Land | Improvement |
|---|---|---|---|---|
| 2024 | $2,105 | $82,840 | $5,440 | $77,400 |
| 2023 | $1,977 | $77,800 | $5,440 | $72,360 |
| 2022 | $1,974 | $73,080 | $5,440 | $67,640 |
| 2021 | $1,501 | $55,568 | $5,440 | $50,128 |
| 2020 | $1,554 | $56,248 | $5,440 | $50,808 |
| 2019 | $1,563 | $56,280 | $5,440 | $50,840 |
| 2018 | $1,457 | $52,600 | $5,440 | $47,160 |
| 2017 | $1,423 | $50,000 | $5,440 | $44,560 |
| 2016 | $1,426 | $50,000 | $5,440 | $44,560 |
| 2015 | $1,413 | $49,120 | $5,440 | $43,680 |
| 2014 | $1,324 | $47,452 | $5,456 | $41,996 |
Source: Public Records
Map
Nearby Homes
- 114 Sycamore Ln
- 116 Sycamore Ln
- 102 Sycamore Ln
- 118 Sycamore Ln
- 113 Sycamore Ln
- 111 Sycamore Ln
- 216 Sycamore Dr
- The Crawford Plan at Sycamore Crest
- The Benson II Plan at Sycamore Crest
- The Norwood II Plan at Sterling at the Villages
- The Piedmont Plan at Sycamore Crest
- The Caldwell Plan at Sycamore Crest
- The McGinnis Plan at Sycamore Crest
- The Bradley Plan at Sycamore Crest
- The Harrington Plan at Sycamore Crest
- 225 Sycamore Dr
- 126 Summerfield Ln NE
- 129 Green Meadow Ln NE
- 1994 Dews Pond Rd NE
- 1982 Dews Pond Rd NE
- 1970 Dews Pond Rd NE
- 1952 Dews Pond Rd NE
- 1958 Dews Pond Rd NE
- 1954 Moss Dr
- 2091 Dews Pond Rd SE
- 2092 Dews Pond Rd NE
- 2080 Dews Pond Rd NE
- 2096 Dews Pond Rd NE
- 1985 Dews Pond Rd SE
- 2107 Dews Pond Rd SE
- 2107 Dews Pond Rd SE
- 2107 Dew''S Pond Rd SE
- 2107 Dews Pond Rd SE
- 1995 Dews Pond Rd SE
- 2121 Dews Pond Rd SE
- 1929 Dews Pond Rd SE
- 260 Colonial Way NE
- 1863 Dews Pond Rd SE