2016 Ensign Way San Jose, CA 95133
Commodore NeighborhoodEstimated Value: $1,668,423 - $1,813,000
About This Home
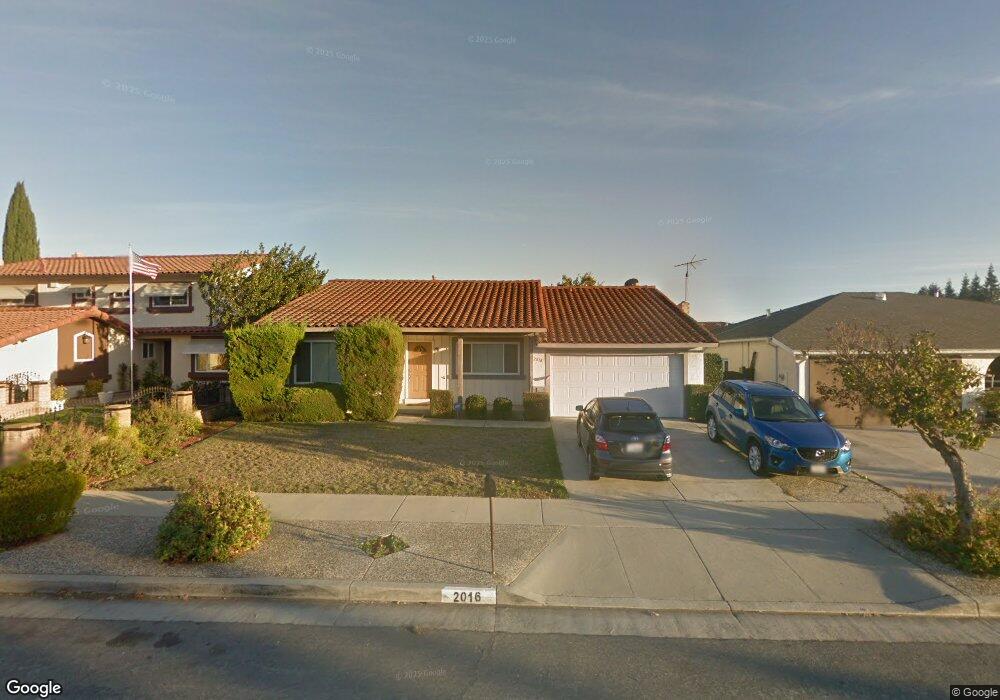
This home is located at 2016 Ensign Way, San Jose, CA 95133 and is currently estimated at $1,742,106, approximately $835 per square foot. 2016 Ensign Way is a home located in Santa Clara County with nearby schools including Vinci Park Elementary School, Piedmont Middle School, and Independence High School.
Ownership History
We collect this data history from publicly available records. To have your information removed, we recommend requesting removal directly through your county’s website.
Purchase Details
Home Financials for this Owner
Home Financials are based on the most recent Mortgage that was taken out on this home.Purchase Details
Home Financials for this Owner
Home Financials are based on the most recent Mortgage that was taken out on this home.Purchase Details
Purchase Details
Home Values in the Area
Average Home Value in this Area
Purchase History
We collect this data history from publicly available records. To have your information removed, we recommend requesting removal directly through your county’s website.
| Date | Buyer | Sale Price | Title Company |
|---|---|---|---|
| -- | First American Title Company | ||
| $745,000 | Chicago Title | ||
| -- | -- | ||
| -- | -- |
Mortgage History
We collect this data history from publicly available records. To have your information removed, we recommend requesting removal directly through your county’s website.
| Date | Status | Borrower | Loan Amount |
|---|---|---|---|
| Open | $622,000 | ||
| Closed | $558,750 |
Tax History
We collect this data history from publicly available records. To have your information removed, we recommend requesting removal directly through your county’s website.
| Year | Tax Paid | Tax Assessment Tax Assessment Total Assessment is a certain percentage of the fair market value that is determined by local assessors to be the total taxable value of land and additions on the property. | Land | Improvement |
|---|---|---|---|---|
| 2025 | $14,104 | $1,018,088 | $610,855 | $407,233 |
| 2024 | $14,104 | $998,127 | $598,878 | $399,249 |
| 2023 | $13,869 | $978,557 | $587,136 | $391,421 |
| 2022 | $13,820 | $959,371 | $575,624 | $383,747 |
| 2021 | $13,392 | $940,561 | $564,338 | $376,223 |
| 2020 | $12,996 | $930,918 | $558,552 | $372,366 |
| 2019 | $12,505 | $912,665 | $547,600 | $365,065 |
| 2018 | $12,336 | $894,770 | $536,863 | $357,907 |
| 2017 | $12,424 | $877,227 | $526,337 | $350,890 |
| 2016 | $11,912 | $860,027 | $516,017 | $344,010 |
| 2015 | $10,734 | $764,000 | $458,400 | $305,600 |
| 2014 | $9,293 | $696,000 | $417,600 | $278,400 |
Map
- 2036 Bluejacket Way
- 1116 Oakbluff Ct
- 2099 Vincenzo Walkway
- 2104 Vincenzo Walkway
- 942 Junesong Way
- 1741 Abington Ct
- 1753 Cape Aston Ct
- 2202 Estee Ct
- 851 Cape Verde Place
- 2354 Bear Valley Ln
- 1735 Chesterton Cir
- 12280 Mabury Rd
- 1146 Rosebriar Way
- 795 N Opie Ct
- 1347 Bertland Ct
- 1682 Commodore Dr
- 1055 N Capitol Ave Unit 184
- 1055 N Capitol Ave Unit 98
- 1055 N Capitol Ave Unit 169
- 1055 N Capitol Ave Unit 194
- 2017 Ensign Way
- 2009 Ensign Way
- 2025 Ensign Way
- 2018 Seaman Place
- 2010 Seaman Place
- 2033 Ensign Way
- 2001 Ensign Way
- 2026 Seaman Place
- 2002 Seaman Place
- 2008 Ensign Way
- 2024 Ensign Way
- 2034 Seaman Place
- 2041 Ensign Way
- 2032 Ensign Way
- 2042 Seaman Place
- 2049 Ensign Way
- 2040 Ensign Way
- 2023 Admiral Place
- 2031 Admiral Place
- 2007 Admiral Place
Ask me questions while you tour the home.