2016 G St Washougal, WA 98671
Estimated Value: $399,000 - $426,000
3
Beds
2
Baths
1,104
Sq Ft
$373/Sq Ft
Est. Value
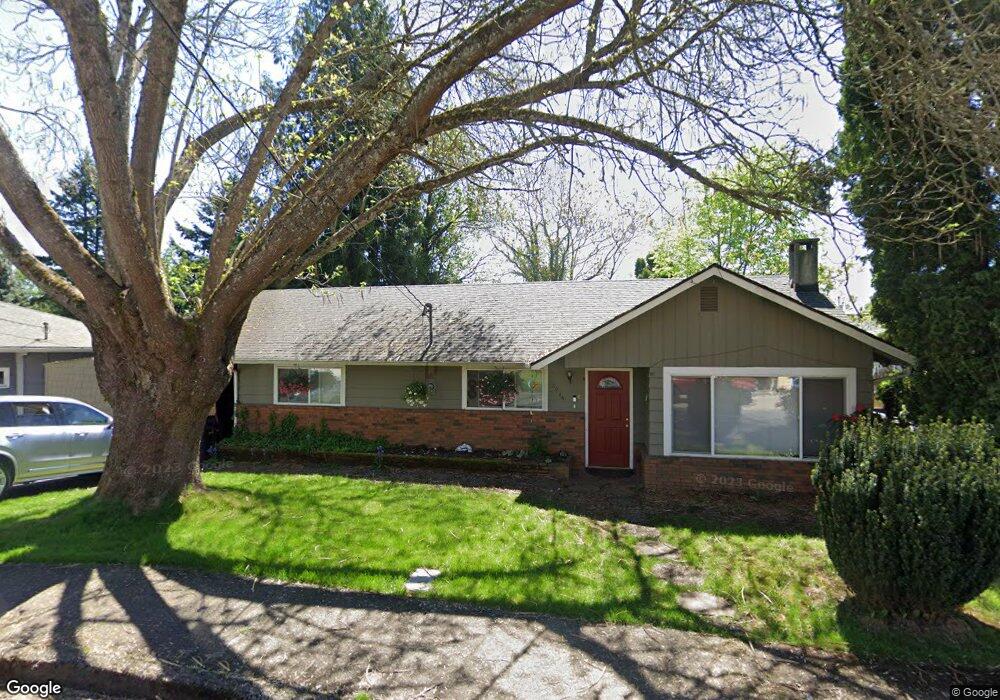
About This Home
This home is located at 2016 G St, Washougal, WA 98671 and is currently estimated at $412,207, approximately $373 per square foot. 2016 G St is a home located in Clark County with nearby schools including Hathaway Elementary School, Jemtegaard Middle School, and Washougal High School.
Ownership History
Date
Name
Owned For
Owner Type
Purchase Details
Closed on
May 5, 2005
Sold by
Carney C John
Bought by
Thomas Carney Marsha
Current Estimated Value
Home Financials for this Owner
Home Financials are based on the most recent Mortgage that was taken out on this home.
Original Mortgage
$122,400
Outstanding Balance
$64,434
Interest Rate
5.99%
Mortgage Type
Fannie Mae Freddie Mac
Estimated Equity
$347,773
Purchase Details
Closed on
Apr 21, 1995
Sold by
Hagensen Mark and Hagensen Lori
Bought by
Howard Danny E and Howard Annetta J
Home Financials for this Owner
Home Financials are based on the most recent Mortgage that was taken out on this home.
Original Mortgage
$91,800
Interest Rate
8.44%
Mortgage Type
Assumption
Create a Home Valuation Report for This Property
The Home Valuation Report is an in-depth analysis detailing your home's value as well as a comparison with similar homes in the area
Home Values in the Area
Average Home Value in this Area
Purchase History
| Date | Buyer | Sale Price | Title Company |
|---|---|---|---|
| Thomas Carney Marsha | -- | Clark County Title | |
| Thomas Carney Marsha J | $153,000 | Clark County Title | |
| Howard Danny E | $90,000 | Charter Title Corp |
Source: Public Records
Mortgage History
| Date | Status | Borrower | Loan Amount |
|---|---|---|---|
| Open | Thomas Carney Marsha J | $122,400 | |
| Previous Owner | Howard Danny E | $91,800 |
Source: Public Records
Tax History Compared to Growth
Tax History
| Year | Tax Paid | Tax Assessment Tax Assessment Total Assessment is a certain percentage of the fair market value that is determined by local assessors to be the total taxable value of land and additions on the property. | Land | Improvement |
|---|---|---|---|---|
| 2025 | $3,430 | $316,210 | $113,663 | $202,547 |
| 2024 | $3,186 | $361,252 | $156,855 | $204,397 |
| 2023 | $3,067 | $351,026 | $156,855 | $194,171 |
| 2022 | $3,102 | $331,045 | $150,035 | $181,010 |
| 2021 | $2,985 | $290,548 | $131,849 | $158,699 |
| 2020 | $2,681 | $262,452 | $119,346 | $143,106 |
| 2019 | $2,231 | $239,414 | $113,663 | $125,751 |
| 2018 | $2,465 | $210,660 | $0 | $0 |
| 2017 | $1,978 | $192,083 | $0 | $0 |
| 2016 | $1,891 | $169,247 | $0 | $0 |
| 2015 | $1,736 | $148,002 | $0 | $0 |
| 2014 | -- | $135,119 | $0 | $0 |
| 2013 | -- | $116,238 | $0 | $0 |
Source: Public Records
Map
Nearby Homes