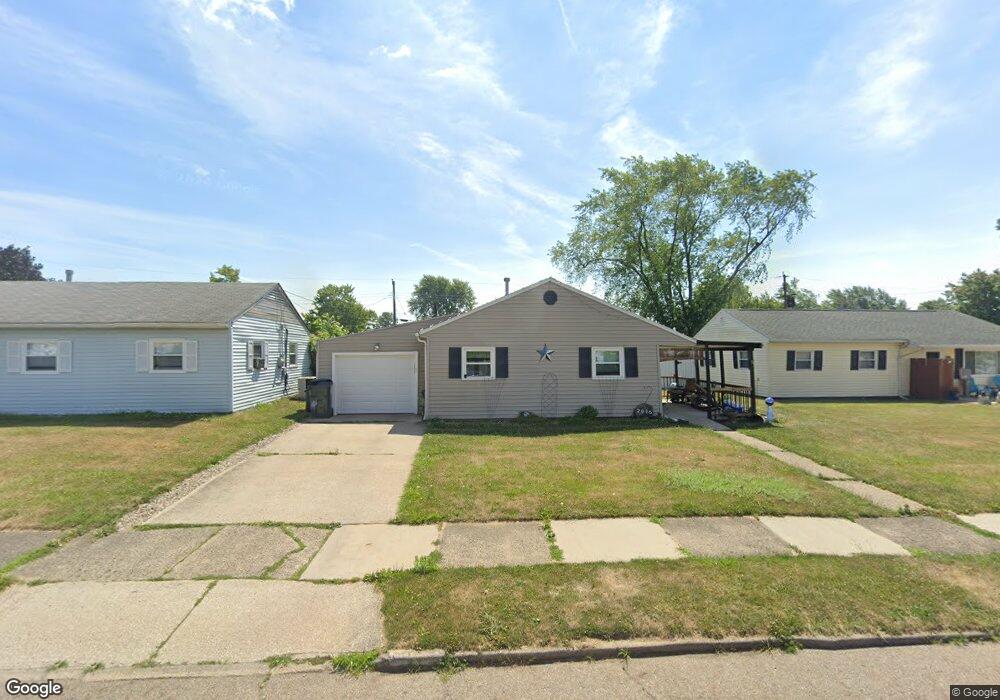
2016 Gridley Ave NE Canton, OH 44705
Fairmount NeighborhoodEstimated Value: $87,513 - $109,000
3
Beds
1
Bath
990
Sq Ft
$102/Sq Ft
Est. Value
About This Home
This home is located at 2016 Gridley Ave NE, Canton, OH 44705 and is currently estimated at $100,878, approximately $101 per square foot. 2016 Gridley Ave NE is a home located in Stark County with nearby schools including Belle Stone Elementary School, Early Learning Center @ Schreiber, and Youtz Intermediate School.
Ownership History
Date
Name
Owned For
Owner Type
Purchase Details
Closed on
Jul 21, 2020
Sold by
Mayle Howard K
Bought by
Gouge Deana M
Current Estimated Value
Purchase Details
Closed on
Apr 26, 2016
Sold by
Canton School Employees Fcu
Bought by
Mayle Howard K
Purchase Details
Closed on
May 18, 2001
Sold by
Morequity Inc
Bought by
Harshberger Joseph G
Purchase Details
Closed on
Aug 10, 2000
Sold by
Powe Kiyawna S
Bought by
Morequity Inc
Purchase Details
Closed on
Jul 18, 2000
Sold by
Powe Kiyawna S and Powe John
Bought by
Morequity Inc
Purchase Details
Closed on
Sep 14, 1998
Sold by
Property Investment Grou
Bought by
Powe Kiyawna S
Purchase Details
Closed on
Mar 30, 1998
Sold by
United National Bank & T
Bought by
Property Investment Group Service
Purchase Details
Closed on
Oct 31, 1991
Purchase Details
Closed on
May 2, 1988
Create a Home Valuation Report for This Property
The Home Valuation Report is an in-depth analysis detailing your home's value as well as a comparison with similar homes in the area
Home Values in the Area
Average Home Value in this Area
Purchase History
| Date | Buyer | Sale Price | Title Company |
|---|---|---|---|
| Gouge Deana M | $18,000 | None Available | |
| Mayle Howard K | $18,000 | None Available | |
| Harshberger Joseph G | $35,000 | Midland Commerce Group | |
| Morequity Inc | $39,000 | -- | |
| Morequity Inc | $39,000 | -- | |
| Powe Kiyawna S | $46,000 | -- | |
| Property Investment Group Service | $35,000 | -- | |
| -- | $32,500 | -- | |
| -- | $32,500 | -- |
Source: Public Records
Mortgage History
| Date | Status | Borrower | Loan Amount |
|---|---|---|---|
| Closed | Powe Kiyawna S | -- |
Source: Public Records
Tax History
| Year | Tax Paid | Tax Assessment Tax Assessment Total Assessment is a certain percentage of the fair market value that is determined by local assessors to be the total taxable value of land and additions on the property. | Land | Improvement |
|---|---|---|---|---|
| 2025 | $7,466 | $23,140 | $4,940 | $18,200 |
| 2024 | $6,004 | $23,140 | $4,940 | $18,200 |
| 2023 | $5,847 | $16,210 | $3,640 | $12,570 |
| 2022 | $944 | $16,210 | $3,640 | $12,570 |
| 2021 | $975 | $16,210 | $3,640 | $12,570 |
| 2020 | $910 | $13,550 | $3,050 | $10,500 |
| 2019 | $791 | $13,550 | $3,050 | $10,500 |
Source: Public Records
Map
Nearby Homes
- 1820 Midway Ave NE
- 1824 Root Ave NE
- 2012 Endrow Ave NE
- 2102 Endrow Ave NE
- 2408 21st St NE
- 2529 17th St NE
- 2215 Willowrow Ave NE
- 3106 22nd St NE
- 2208 Willowrow Ave NE
- 2103 Bollinger Ave NE
- 1604 Wooster Ave NE
- 1742 Taft Ave NE
- 2438 Indiana Way NE
- 2328 26th St NE
- 2616 Taft Ave NE
- 3148 26th St NE
- 2111 21st St NE
- 2211 17th St NE
- 2216 17th St NE
- 2321 15th St NE
- 2012 Gridley Ave NE
- 2022 Gridley Ave NE
- 2006 Gridley Ave NE
- 2028 Gridley Ave NE
- 2019 Morris Ave NE
- 2025 Morris Ave NE
- 2013 Morris Ave NE
- 2007 Morris Ave NE
- 2101 Morris Ave NE
- 2000 Gridley Ave NE
- 2015 Gridley Ave NE
- 2021 Gridley Ave NE
- 2009 Gridley Ave NE
- 2656 22nd St NE
- 2108 Gridley Ave NE
- 2027 Gridley Ave NE
- 2103 Gridley Ave NE
- 2001 Morris Ave NE
- 2662 22nd St NE
- 1930 Gridley Ave NE
Your Personal Tour Guide
Ask me questions while you tour the home.