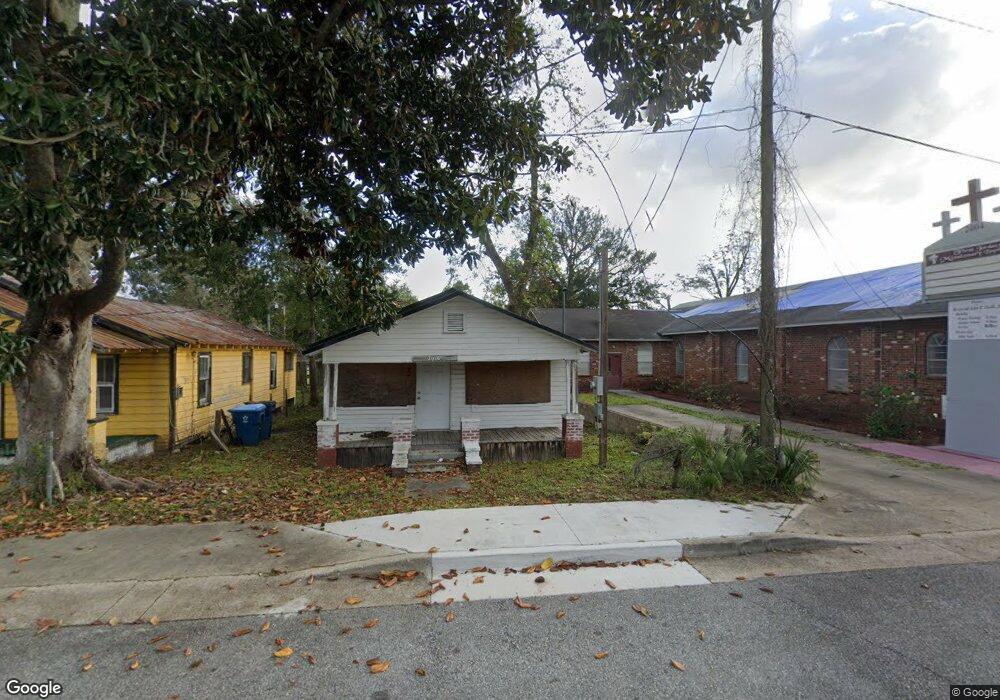
2016 Mlk jr Blvd Brunswick, GA 31520
Town Commons NeighborhoodEstimated Value: $66,267 - $154,000
2
Beds
1
Bath
748
Sq Ft
$124/Sq Ft
Est. Value
About This Home
This home is located at 2016 Mlk jr Blvd, Brunswick, GA 31520 and is currently estimated at $92,817, approximately $124 per square foot. 2016 Mlk jr Blvd is a home located in Glynn County with nearby schools including Burroughs-Molette Elementary School, Glynn Middle School, and Glynn Academy.
Ownership History
Date
Name
Owned For
Owner Type
Purchase Details
Closed on
Nov 9, 2020
Sold by
A Properties Llc
Bought by
Coastal Lifestyle By Design Llc
Current Estimated Value
Purchase Details
Closed on
Dec 3, 2019
Sold by
City Of Brunswick Georgia
Bought by
A Properties Llc
Purchase Details
Closed on
Jul 20, 2018
Sold by
Thompson Lavonia
Bought by
Coastal Lifestyle By Design Llc
Home Financials for this Owner
Home Financials are based on the most recent Mortgage that was taken out on this home.
Original Mortgage
$5,000
Interest Rate
4.5%
Mortgage Type
New Conventional
Purchase Details
Closed on
Jul 3, 2018
Sold by
Rosby Odell G
Bought by
Thompson Lavonia
Home Financials for this Owner
Home Financials are based on the most recent Mortgage that was taken out on this home.
Original Mortgage
$5,000
Interest Rate
4.5%
Mortgage Type
New Conventional
Purchase Details
Closed on
Oct 18, 2017
Sold by
Stephens Charles
Bought by
Rosby Odell G
Create a Home Valuation Report for This Property
The Home Valuation Report is an in-depth analysis detailing your home's value as well as a comparison with similar homes in the area
Home Values in the Area
Average Home Value in this Area
Purchase History
| Date | Buyer | Sale Price | Title Company |
|---|---|---|---|
| Coastal Lifestyle By Design Llc | -- | -- | |
| A Properties Llc | $922 | -- | |
| Coastal Lifestyle By Design Llc | -- | -- | |
| Thompson Lavonia | $10,000 | -- | |
| Rosby Odell G | -- | -- |
Source: Public Records
Mortgage History
| Date | Status | Borrower | Loan Amount |
|---|---|---|---|
| Previous Owner | Thompson Lavonia | $5,000 |
Source: Public Records
Tax History Compared to Growth
Tax History
| Year | Tax Paid | Tax Assessment Tax Assessment Total Assessment is a certain percentage of the fair market value that is determined by local assessors to be the total taxable value of land and additions on the property. | Land | Improvement |
|---|---|---|---|---|
| 2025 | $557 | $26,520 | $4,920 | $21,600 |
| 2024 | $531 | $25,280 | $3,680 | $21,600 |
| 2023 | $1,036 | $19,760 | $3,680 | $16,080 |
| 2022 | $885 | $15,320 | $2,480 | $12,840 |
| 2021 | $683 | $10,360 | $2,480 | $7,880 |
| 2020 | $687 | $10,360 | $2,480 | $7,880 |
| 2019 | $89 | $4,000 | $3,680 | $320 |
| 2018 | $297 | $12,360 | $3,680 | $8,680 |
| 2017 | $717 | $12,360 | $3,680 | $8,680 |
| 2016 | $628 | $12,360 | $3,680 | $8,680 |
| 2015 | $651 | $12,360 | $3,680 | $8,680 |
| 2014 | $651 | $12,360 | $3,680 | $8,680 |
Source: Public Records
Map
Nearby Homes
- 1922 Stonewall St
- 1009 K St
- 2308 Albany St
- 2314 Wolfe St
- 1709 Amherst St
- 1311 G St
- 2123 Ellis St
- 2116 Union St
- 1910 Tillman Ave
- 1621 Lee St
- 2210 J St
- 2029 Reynolds St
- 1811 F St
- 1701 Niles Ave
- 2229 Reynolds St
- 1525 Tillman Ave
- 2329 Reynolds St
- 2611 Albany St
- 1414 Martin Luther King Blvd
- 1410 Martin Luther King Blvd
- 2020 Mlk jr Blvd
- 2022 Mlk jr Blvd
- 2017 Stonewall St
- 2025 Stonewall St
- 2024 Martin Luther King jr Blvd
- 2027 Stonewall St
- 2028 Mlk jr Blvd
- 1510 K St
- 1308 Kansas St
- 2029 Stonewall St
- 2100 Mlk jr Blvd
- 2012 Stonewall St
- 2024 Stonewall St
- 2010 Stonewall St
- 2004 Stonewall St
- 2026 Stonewall St
- 0 Martin Luther King Blvd
- 1506 J St
- 2118 Mlk jr Blvd
- 1504 J St