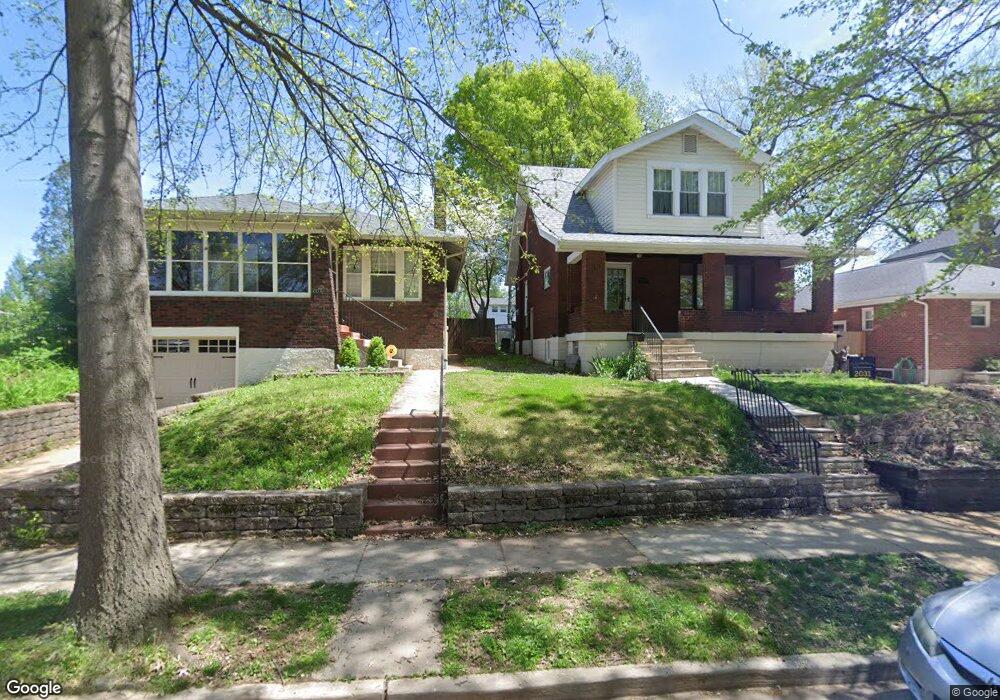
2016 Princeton Place Saint Louis, MO 63117
Estimated Value: $275,661 - $322,000
2
Beds
1
Bath
1,232
Sq Ft
$239/Sq Ft
Est. Value
About This Home
This home is located at 2016 Princeton Place, Saint Louis, MO 63117 and is currently estimated at $294,665, approximately $239 per square foot. 2016 Princeton Place is a home located in St. Louis County with nearby schools including Maplewood Richmond Heights Elementary School, Maplewood Richmond Heights Middle School, and Maplewood-Richmond Heights High School.
Ownership History
Date
Name
Owned For
Owner Type
Purchase Details
Closed on
Aug 15, 2008
Sold by
Alexander Noah J
Bought by
Fortner Leslie A
Current Estimated Value
Purchase Details
Closed on
May 25, 2005
Sold by
Brunnquell Sara M and Brunnquell John
Bought by
Leidenfrost Nicholas Alexander
Home Financials for this Owner
Home Financials are based on the most recent Mortgage that was taken out on this home.
Original Mortgage
$168,800
Interest Rate
5.83%
Mortgage Type
Fannie Mae Freddie Mac
Purchase Details
Closed on
Jun 29, 2001
Sold by
Hammer David M and Hammer Judith M
Bought by
Johnson Sara M
Home Financials for this Owner
Home Financials are based on the most recent Mortgage that was taken out on this home.
Original Mortgage
$132,500
Interest Rate
6.87%
Purchase Details
Closed on
May 29, 1998
Sold by
Kuehling Karl H and Kuehling Mary M
Bought by
Hammer David M and Hammer Judith M
Home Financials for this Owner
Home Financials are based on the most recent Mortgage that was taken out on this home.
Original Mortgage
$71,575
Interest Rate
7.2%
Mortgage Type
FHA
Create a Home Valuation Report for This Property
The Home Valuation Report is an in-depth analysis detailing your home's value as well as a comparison with similar homes in the area
Home Values in the Area
Average Home Value in this Area
Purchase History
| Date | Buyer | Sale Price | Title Company |
|---|---|---|---|
| Fortner Leslie A | -- | None Available | |
| Leidenfrost Nicholas Alexander | $211,000 | Ort | |
| Johnson Sara M | $139,500 | -- | |
| Hammer David M | -- | First American Title |
Source: Public Records
Mortgage History
| Date | Status | Borrower | Loan Amount |
|---|---|---|---|
| Previous Owner | Leidenfrost Nicholas Alexander | $168,800 | |
| Previous Owner | Johnson Sara M | $132,500 | |
| Previous Owner | Hammer David M | $71,575 |
Source: Public Records
Tax History Compared to Growth
Tax History
| Year | Tax Paid | Tax Assessment Tax Assessment Total Assessment is a certain percentage of the fair market value that is determined by local assessors to be the total taxable value of land and additions on the property. | Land | Improvement |
|---|---|---|---|---|
| 2025 | $3,515 | $52,170 | $31,120 | $21,050 |
| 2024 | $3,515 | $45,750 | $19,190 | $26,560 |
| 2023 | $3,484 | $45,750 | $19,190 | $26,560 |
| 2022 | $3,275 | $39,770 | $23,030 | $16,740 |
| 2021 | $3,219 | $39,770 | $23,030 | $16,740 |
| 2020 | $3,218 | $37,700 | $19,380 | $18,320 |
| 2019 | $3,193 | $37,700 | $19,380 | $18,320 |
| 2018 | $2,917 | $31,220 | $12,390 | $18,830 |
| 2017 | $2,897 | $31,220 | $12,390 | $18,830 |
| 2016 | $2,699 | $28,030 | $11,440 | $16,590 |
| 2015 | $2,537 | $28,030 | $11,440 | $16,590 |
| 2014 | $2,408 | $26,660 | $8,800 | $17,860 |
Source: Public Records
Map
Nearby Homes
- 7400 Williams Ave
- 2024 Bellevue Ave
- 7129 Glades Ave
- 2029 Blendon Place
- 2049 Blendon Place
- 7264 Richmond Place
- 2117 Yale Ave
- 2213 Yale Ave
- 2010 Blendon Place
- 7027 Plateau Ave
- 7342 Dale Ave
- 2052 Mccausland Ave
- 2118 Mccausland Ave
- 1723 Mccready Ave
- 1338 Sunset Ave
- 2522 Bellevue Ave
- 7590 W Bruno Ave
- 7555 Alicia Ave
- 2604 Bellevue Ave
- 1925 Forest Ave
- 2018 Princeton Place
- 2020 Princeton Place
- 2024 Princeton Place
- 2009 Alameda Ave
- 2015 Alameda Ave
- 2026 Princeton Place
- 2017 Alameda Ave
- 2017 Princeton Place
- 2019 Princeton Place
- 2028 Princeton Place
- 1815 Princeton Place
- 2021 Princeton Place
- 1813 Princeton Place
- 2019 Alameda Ave
- 2023 Princeton Place
- 1811 Princeton Place
- 2030 Princeton Place
- 2025 Princeton Place
- 1809 Princeton Place
- 2029 Alameda Ave