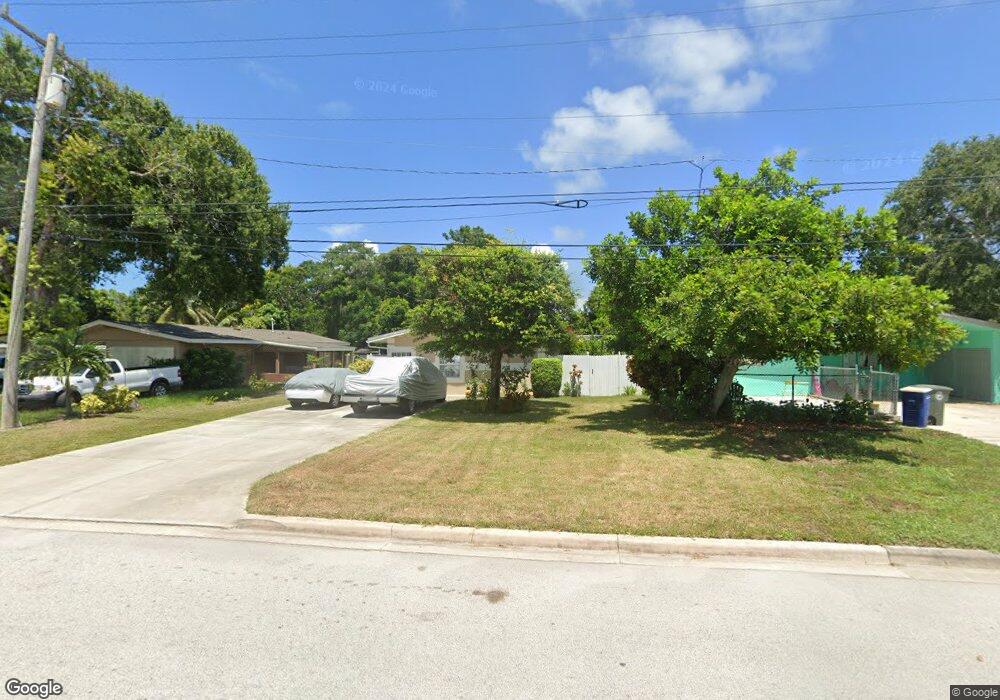
2016 S 11th St Fort Pierce, FL 34950
Downtown Fort Pierce NeighborhoodEstimated Value: $233,000 - $367,000
3
Beds
2
Baths
1,400
Sq Ft
$192/Sq Ft
Est. Value
About This Home
This home is located at 2016 S 11th St, Fort Pierce, FL 34950 and is currently estimated at $268,501, approximately $191 per square foot. 2016 S 11th St is a home located in St. Lucie County with nearby schools including St. Lucie Elementary School, Lawnwood Elementary School, and Chester A. Moore Elementary School.
Ownership History
Date
Name
Owned For
Owner Type
Purchase Details
Closed on
Sep 27, 1999
Sold by
Magana Jose L
Bought by
Gamez Ramon R and Gamez Margarita M
Current Estimated Value
Purchase Details
Closed on
Oct 15, 1997
Sold by
Farmer Richard G and Farmer Ethel Anne
Bought by
Gamez Ramon E and Gamez Margarita M
Home Financials for this Owner
Home Financials are based on the most recent Mortgage that was taken out on this home.
Original Mortgage
$53,936
Interest Rate
7.55%
Mortgage Type
FHA
Create a Home Valuation Report for This Property
The Home Valuation Report is an in-depth analysis detailing your home's value as well as a comparison with similar homes in the area
Home Values in the Area
Average Home Value in this Area
Purchase History
| Date | Buyer | Sale Price | Title Company |
|---|---|---|---|
| Gamez Ramon R | $26,500 | -- | |
| Gamez Ramon E | $54,000 | -- |
Source: Public Records
Mortgage History
| Date | Status | Borrower | Loan Amount |
|---|---|---|---|
| Previous Owner | Gamez Ramon E | $53,936 |
Source: Public Records
Tax History
| Year | Tax Paid | Tax Assessment Tax Assessment Total Assessment is a certain percentage of the fair market value that is determined by local assessors to be the total taxable value of land and additions on the property. | Land | Improvement |
|---|---|---|---|---|
| 2025 | $731 | $60,757 | -- | -- |
| 2024 | $727 | $59,045 | -- | -- |
| 2023 | $727 | $57,326 | $0 | $0 |
| 2022 | $721 | $55,657 | $0 | $0 |
| 2021 | $731 | $54,036 | $0 | $0 |
| 2020 | $735 | $53,290 | $0 | $0 |
| 2019 | $735 | $52,092 | $0 | $0 |
| 2018 | $693 | $51,121 | $0 | $0 |
| 2017 | $692 | $76,600 | $10,800 | $65,800 |
| 2016 | $672 | $58,900 | $5,700 | $53,200 |
| 2015 | $674 | $51,400 | $5,700 | $45,700 |
| 2014 | $648 | $48,314 | $0 | $0 |
Source: Public Records
Map
Nearby Homes
- 2008 S 10th St Unit C
- 2018 S 10th St Unit C
- 2007 Oleander Blvd Unit C
- 2007 Oleander Blvd Unit D
- 2005 Oleander Blvd Unit D
- 2001 Oleander Blvd Unit C
- 2302 Sunrise Blvd Unit 202
- 2302 Sunrise Blvd Unit 204
- 2302 Sunrise Blvd Unit 3-201
- 2302 Sunrise Blvd Unit 1-103
- 2302 Sunrise Blvd Unit 201
- 2405 Sunrise Blvd
- 0 Oleander Ave Unit R11149344
- 2050 Oleander Blvd Unit 9-209
- 2050 Oleander Blvd Unit 2-206
- 2050 Oleander Blvd Unit 10-206
- 2050 Oleander Blvd Unit 10-203
- 2050 Oleander Blvd Unit 4203
- 2050 Oleander Blvd Unit 10-106
- 2050 Oleander Blvd Unit 5-202 10-106 10-2
- 2014 S 11th St
- 1010 Tennessee Ave
- 2012 S 11th St
- 2019 Sunrise Blvd
- 2021 Sunrise Blvd
- 2017 Sunrise Blvd
- 2010 S 11th St
- 2101 Sunrise Blvd
- 2008 S 11th St
- 2103 Sunrise Blvd
- 2007 Sunrise Blvd
- 2018 Sunrise Blvd
- 2020 Sunrise Blvd
- 2016 Sunrise Blvd
- 2014 Sunrise Blvd
- 2107 Sunrise Blvd Unit 1 OF 3
- 2107 Sunrise Blvd
- 1105 Southern Ave
- 1107 Southern Ave
- 2100 Sunrise Blvd
Your Personal Tour Guide
Ask me questions while you tour the home.