Estimated Value: $419,000 - $423,078
4
Beds
3
Baths
2,400
Sq Ft
$175/Sq Ft
Est. Value
About This Home
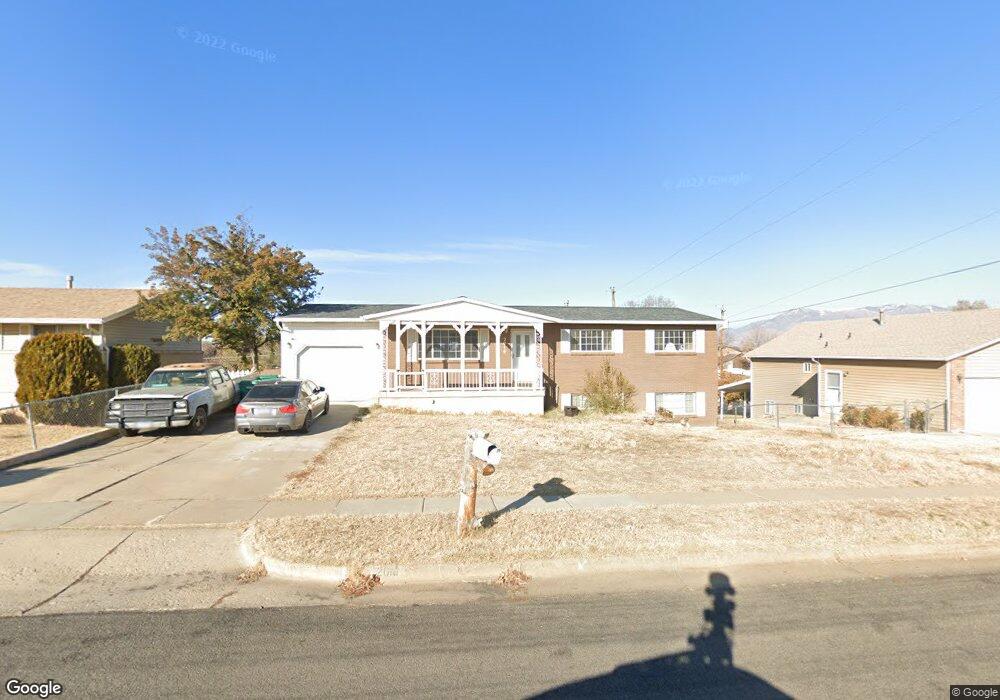
This home is located at 2016 W 4600 S, Roy, UT 84067 and is currently estimated at $421,020, approximately $175 per square foot. 2016 W 4600 S is a home located in Weber County with nearby schools including North Park School, Sand Ridge Junior High School, and Roy High School.
Ownership History
Date
Name
Owned For
Owner Type
Purchase Details
Closed on
Nov 24, 2021
Sold by
Martin and Sydney
Bought by
Martin Dustin
Current Estimated Value
Home Financials for this Owner
Home Financials are based on the most recent Mortgage that was taken out on this home.
Original Mortgage
$284,900
Outstanding Balance
$262,138
Interest Rate
3.14%
Mortgage Type
FHA
Estimated Equity
$158,882
Purchase Details
Closed on
Jun 30, 2016
Bought by
Martin Dustin
Home Financials for this Owner
Home Financials are based on the most recent Mortgage that was taken out on this home.
Original Mortgage
$188,522
Interest Rate
3.48%
Purchase Details
Closed on
Jul 10, 2014
Sold by
Strebel Sharie and Atkinson Tamara
Bought by
Strebel Sharie and Atkinson Tamara
Purchase Details
Closed on
Sep 7, 2000
Sold by
Morgan Winnifred L
Bought by
Morgan Winnifred L and Strebel Sharie
Purchase Details
Closed on
May 9, 1997
Sold by
Fuentes Michael P and Fuentes Carol E
Bought by
Morgan Winnifred L
Create a Home Valuation Report for This Property
The Home Valuation Report is an in-depth analysis detailing your home's value as well as a comparison with similar homes in the area
Home Values in the Area
Average Home Value in this Area
Purchase History
| Date | Buyer | Sale Price | Title Company |
|---|---|---|---|
| Martin Dustin | -- | Advantage Title | |
| Martin Dustin | -- | -- | |
| Strebel Sharie | -- | None Available | |
| Morgan Winnifred L | -- | Bonneville Title Company | |
| Morgan Winnifred L | -- | Associated Title |
Source: Public Records
Mortgage History
| Date | Status | Borrower | Loan Amount |
|---|---|---|---|
| Open | Martin Dustin | $284,900 | |
| Previous Owner | Martin Dustin | $190,098 | |
| Previous Owner | Martin Dustin | $188,522 | |
| Previous Owner | Martin Dustin | -- |
Source: Public Records
Tax History Compared to Growth
Tax History
| Year | Tax Paid | Tax Assessment Tax Assessment Total Assessment is a certain percentage of the fair market value that is determined by local assessors to be the total taxable value of land and additions on the property. | Land | Improvement |
|---|---|---|---|---|
| 2025 | $2,596 | $411,170 | $117,172 | $293,998 |
| 2024 | $2,533 | $222,199 | $64,445 | $157,754 |
| 2023 | $2,520 | $222,200 | $61,979 | $160,221 |
| 2022 | $2,341 | $210,650 | $56,792 | $153,858 |
| 2021 | $2,004 | $297,000 | $12,160 | $284,840 |
| 2020 | $1,914 | $261,000 | $12,160 | $248,840 |
| 2019 | $1,806 | $231,000 | $38,966 | $192,034 |
| 2018 | $1,744 | $210,000 | $33,939 | $176,061 |
| 2017 | $1,564 | $175,000 | $32,153 | $142,847 |
| 2016 | $1,557 | $94,049 | $19,225 | $74,824 |
| 2015 | $1,365 | $83,504 | $19,225 | $64,279 |
| 2014 | $1,274 | $76,307 | $19,225 | $57,082 |
Source: Public Records
Map
Nearby Homes
- 2038 W 4600 S
- 4475 S 1975 W
- 4642 S 1900 W Unit 41
- 4536 S 1900 W Unit 12
- 2082 W 4450 S
- 2067 W 4750 S
- 1825 W 4500 S Unit 101
- 2259 W 4525 S
- 4602 Hathaway Dr
- 1766 W 4575 S
- 1825 W 4400 S
- 4848 S 2125 W
- 2153 W 4800 S
- 2263 W 4400 S
- 4501 S 1720 W
- 4593 Promenade Dr
- 4502 S 1720 W
- 4328 S 2175 W
- 4552 S 1675 W
- 1681 W 4450 S