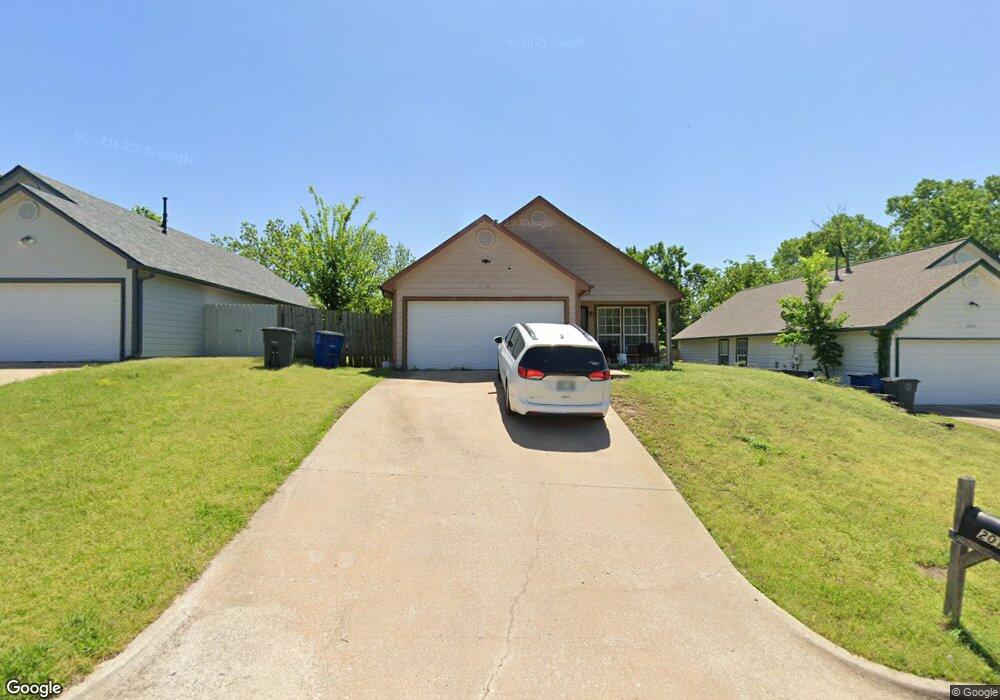
2016 W 57th St Tulsa, OK 74107
Red Fork NeighborhoodEstimated Value: $161,648 - $193,000
3
Beds
2
Baths
1,064
Sq Ft
$169/Sq Ft
Est. Value
About This Home
This home is located at 2016 W 57th St, Tulsa, OK 74107 and is currently estimated at $179,412, approximately $168 per square foot. 2016 W 57th St is a home located in Tulsa County with nearby schools including Clinton West Elementary School, Daniel Webster High School, and Riverfield Country Day School.
Ownership History
Date
Name
Owned For
Owner Type
Purchase Details
Closed on
Oct 17, 2014
Sold by
Onb Bank And Trust Co
Bought by
P2 Equity Inc
Current Estimated Value
Home Financials for this Owner
Home Financials are based on the most recent Mortgage that was taken out on this home.
Original Mortgage
$49,258
Interest Rate
4.12%
Mortgage Type
New Conventional
Purchase Details
Closed on
Mar 13, 1999
Sold by
Norwest Mtg Inc
Bought by
Hud
Purchase Details
Closed on
Dec 31, 1998
Sold by
Glanz Stanley and Mcfee Wayne K
Bought by
Norwest Mtg Inc
Purchase Details
Closed on
Jun 24, 1997
Sold by
Whitehorse Investment Ltd Liability Co
Bought by
Realpro Ltd Liability Company
Home Financials for this Owner
Home Financials are based on the most recent Mortgage that was taken out on this home.
Original Mortgage
$327,611
Interest Rate
7.93%
Mortgage Type
Purchase Money Mortgage
Create a Home Valuation Report for This Property
The Home Valuation Report is an in-depth analysis detailing your home's value as well as a comparison with similar homes in the area
Home Values in the Area
Average Home Value in this Area
Purchase History
| Date | Buyer | Sale Price | Title Company |
|---|---|---|---|
| P2 Equity Inc | $300,000 | Commercial Title & Escrow Sv | |
| Hud | -- | Smith Bros Abstract Co | |
| Norwest Mtg Inc | -- | -- | |
| Realpro Ltd Liability Company | $139,500 | -- |
Source: Public Records
Mortgage History
| Date | Status | Borrower | Loan Amount |
|---|---|---|---|
| Closed | P2 Equity Inc | $49,258 | |
| Previous Owner | Realpro Ltd Liability Company | $327,611 |
Source: Public Records
Tax History
| Year | Tax Paid | Tax Assessment Tax Assessment Total Assessment is a certain percentage of the fair market value that is determined by local assessors to be the total taxable value of land and additions on the property. | Land | Improvement |
|---|---|---|---|---|
| 2025 | $1,613 | $12,034 | $1,350 | $10,684 |
| 2024 | $1,385 | $11,461 | $1,910 | $9,551 |
| 2023 | $1,385 | $10,915 | $1,819 | $9,096 |
| 2022 | $1,386 | $10,396 | $1,733 | $8,663 |
| 2021 | $1,307 | $9,900 | $1,650 | $8,250 |
| 2020 | $1,290 | $9,900 | $1,650 | $8,250 |
| 2019 | $1,356 | $9,900 | $1,650 | $8,250 |
| 2018 | $1,360 | $9,900 | $1,650 | $8,250 |
| 2017 | $1,357 | $9,900 | $1,650 | $8,250 |
| 2016 | $1,329 | $9,900 | $1,650 | $8,250 |
| 2015 | $1,332 | $9,900 | $1,650 | $8,250 |
| 2014 | $1,509 | $11,330 | $1,650 | $9,680 |
Source: Public Records
Map
Nearby Homes
- 6102 S Waco Ave
- 6103 S 28th West Ave
- 5334 S 30th West Ave
- 4886 S Vancouver Ave
- 3130 W 58th St
- 6033 S 31st West Ave
- 2524 W 51st St
- 2102 W 58th St
- 6461 S 28th West Ave
- 2510 W 66th Place
- 6101 S 33rd West Ave
- 4824 S 25th West Ave
- 2921 W 64th St
- 1315 W 49th St
- 6513 S 29th West Place
- 5154 S 34th West Ave
- 3418 W Skelly Dr
- 1934 W 46th Place
- 4713 S 27th West Ave
- 4855 S Maybelle Ave
- 2012 W 57th St
- 2020 W 57th St
- 2008 W 57th St
- 2024 W 57th St
- 2004 W 57th St
- 2017 W 57th St
- 2007 W 57th St
- 2028 W 57th St
- 5655 S Xenophon Ave
- 1867 W 57th Place
- 1875 W 57th Place
- 5656 S Xenophon Ave
- 1863 W 57th Place
- 1903 W 57th Place
- 5623 S Yukon Ave
- 2032 W 57th St
- 1859 W 57th Place
- 5651 S Xenophon Ave
- 5652 S Xenophon Ave
- 1855 W 57th Place
Your Personal Tour Guide
Ask me questions while you tour the home.