20160 Rensellor St Unit Bldg-Unit Livonia, MI 48152
Estimated Value: $250,000 - $300,000
3
Beds
3
Baths
1,118
Sq Ft
$250/Sq Ft
Est. Value
About This Home
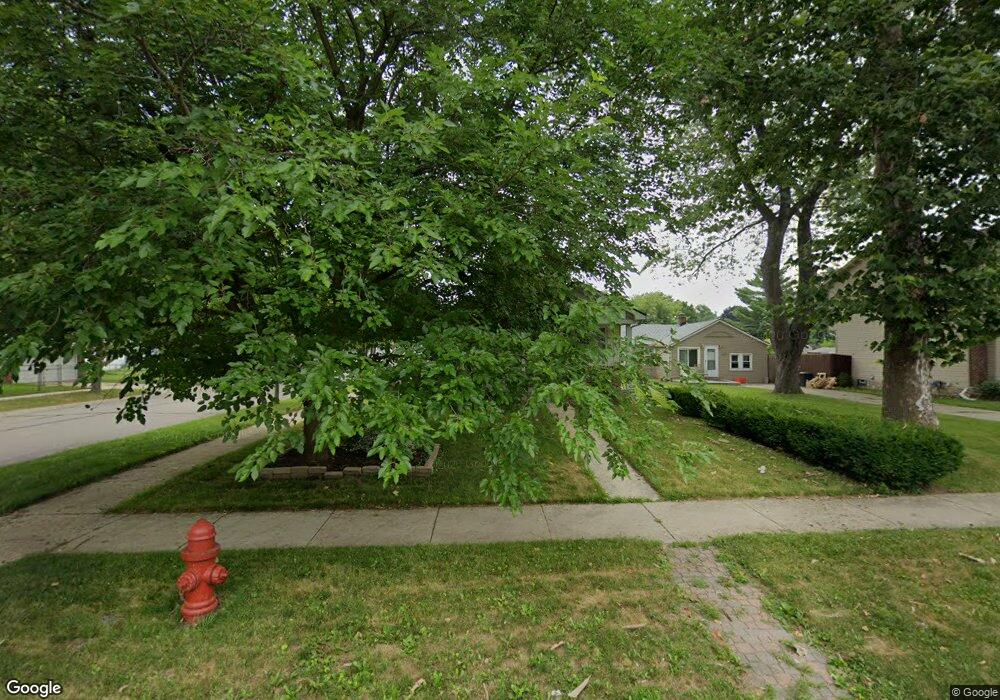
This home is located at 20160 Rensellor St Unit Bldg-Unit, Livonia, MI 48152 and is currently estimated at $279,550, approximately $250 per square foot. 20160 Rensellor St Unit Bldg-Unit is a home located in Wayne County with nearby schools including Clarenceville High School, David Ellis Academy West, and Grand River Academy.
Ownership History
Date
Name
Owned For
Owner Type
Purchase Details
Closed on
May 31, 2018
Sold by
Brown Keith J
Bought by
Sudduth Donald
Current Estimated Value
Home Financials for this Owner
Home Financials are based on the most recent Mortgage that was taken out on this home.
Original Mortgage
$169,750
Outstanding Balance
$146,805
Interest Rate
4.5%
Mortgage Type
New Conventional
Estimated Equity
$132,745
Purchase Details
Closed on
May 19, 2017
Sold by
Hunter Keith T and Hunter Kimberly M
Bought by
Brown Ii Keith J
Purchase Details
Closed on
Jul 21, 2011
Sold by
Prudential Relocation Inc
Bought by
Hunter Keith T and Sabatini Kimberly M
Purchase Details
Closed on
Jul 15, 2011
Sold by
Baldwin Mark and Baldwin Blandine
Bought by
Prudential Relocation Inc
Purchase Details
Closed on
Jun 27, 2001
Sold by
Vitori Karen M
Bought by
Baldwin Mark
Purchase Details
Closed on
Dec 17, 1997
Sold by
Optimum Dev Inc
Bought by
Vitori Paul D
Create a Home Valuation Report for This Property
The Home Valuation Report is an in-depth analysis detailing your home's value as well as a comparison with similar homes in the area
Home Values in the Area
Average Home Value in this Area
Purchase History
| Date | Buyer | Sale Price | Title Company |
|---|---|---|---|
| Sudduth Donald | $175,000 | Devon Title Co | |
| Brown Ii Keith J | $152,500 | None Available | |
| Hunter Keith T | $70,000 | Stewart Title Guaranty Co | |
| Prudential Relocation Inc | $70,000 | Stewart Title Guaranty Co | |
| Baldwin Mark | $163,040 | -- | |
| Vitori Paul D | $103,000 | -- |
Source: Public Records
Mortgage History
| Date | Status | Borrower | Loan Amount |
|---|---|---|---|
| Open | Sudduth Donald | $169,750 |
Source: Public Records
Tax History Compared to Growth
Tax History
| Year | Tax Paid | Tax Assessment Tax Assessment Total Assessment is a certain percentage of the fair market value that is determined by local assessors to be the total taxable value of land and additions on the property. | Land | Improvement |
|---|---|---|---|---|
| 2025 | $2,045 | $127,300 | $0 | $0 |
| 2024 | $2,045 | $115,100 | $0 | $0 |
| 2023 | $1,955 | $104,200 | $0 | $0 |
| 2022 | $3,249 | $94,600 | $0 | $0 |
| 2021 | $3,162 | $89,400 | $0 | $0 |
| 2019 | $3,081 | $82,000 | $0 | $0 |
| 2018 | $1,411 | $66,700 | $0 | $0 |
| 2017 | $1,372 | $55,700 | $0 | $0 |
| 2016 | $1,554 | $55,700 | $0 | $0 |
| 2015 | $4,087 | $50,880 | $0 | $0 |
| 2012 | -- | $43,110 | $6,690 | $36,420 |
Source: Public Records
Map
Nearby Homes
- 27440 Fargo St
- 20135 Saint Francis St
- 20107 Saint Francis St
- 27725 Norfolk St
- 19904 Seminole
- 19925 Negaunee
- 19816 Poinciana
- 19661 Antago St
- 20229 Floral St
- 19643 Inkster Rd
- 19783 Poinciana
- 19701 Seminole
- 19928 Indian
- 19754 Negaunee
- 19499 Saint Francis St
- 19493 Negaunee
- 19435 Inkster Rd
- 19424 Inkster Rd
- 20379 Gaylord
- 20919 Saint Francis St
- 20160 Rensellor St
- 20150 Rensellor St
- 20142 Rensellor St
- 20200 Rensellor St
- 20134 Rensellor St
- 20097 Inkster Rd Unit Bldg-Unit
- 20097 Inkster Rd
- 20091 Inkster Rd
- 20210 Rensellor St
- 20130 Rensellor St
- 20209 Inkster Rd
- 20075 Inkster Rd
- 20216 Rensellor St
- 20409 Inkster Rd
- 20159 Rensellor St
- 20128 Rensellor St
- 20141 Rensellor St
- 20065 Inkster Rd
- 20201 Rensellor St
- 20415 Inkster Rd