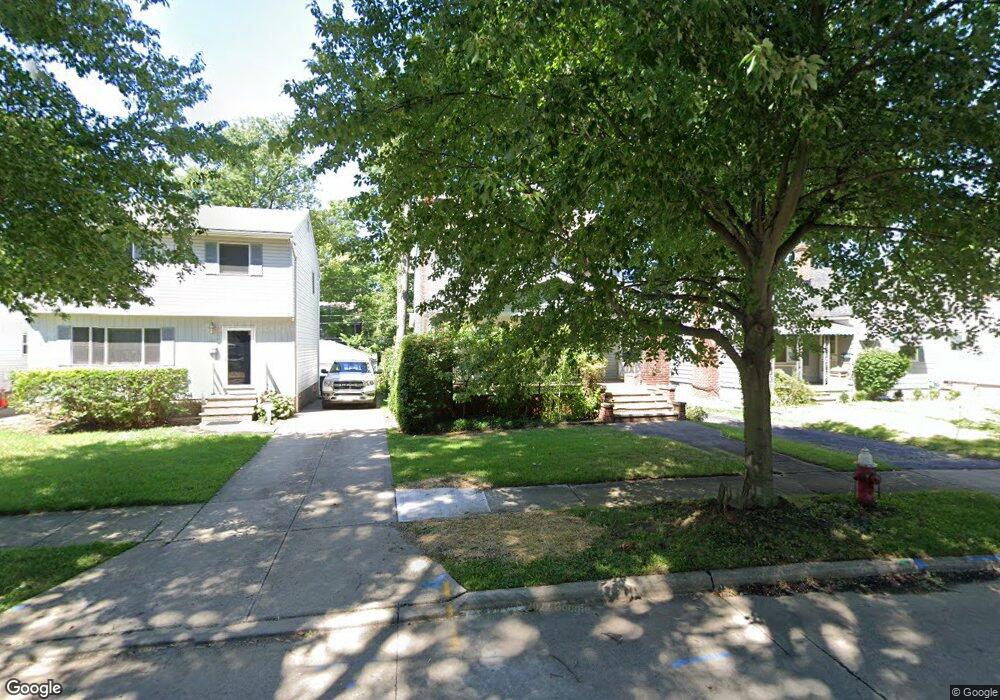
20161 Champ Dr Euclid, OH 44117
Estimated Value: $127,000 - $158,000
3
Beds
1
Bath
1,261
Sq Ft
$111/Sq Ft
Est. Value
About This Home
This home is located at 20161 Champ Dr, Euclid, OH 44117 and is currently estimated at $140,228, approximately $111 per square foot. 20161 Champ Dr is a home located in Cuyahoga County with nearby schools including Bluestone Elementary School, Euclid Middle School, and Euclid High School.
Ownership History
Date
Name
Owned For
Owner Type
Purchase Details
Closed on
Apr 15, 2013
Sold by
Johnson Kriss E and Johnson Sheila D
Bought by
Johnson Lucian E and Johnson Sheila D
Current Estimated Value
Purchase Details
Closed on
Oct 9, 2002
Sold by
Johnson Lucian E and Johnson Sheila D
Bought by
Trust Gene Ra Investments
Purchase Details
Closed on
Oct 16, 1995
Sold by
Dams Douglas G
Bought by
Johnson Kriss E
Home Financials for this Owner
Home Financials are based on the most recent Mortgage that was taken out on this home.
Original Mortgage
$76,900
Interest Rate
8.2%
Mortgage Type
VA
Purchase Details
Closed on
Aug 12, 1985
Sold by
Stuckert Dale E and Stuckert Carol
Bought by
Dams Douglas G
Purchase Details
Closed on
Mar 6, 1981
Sold by
Drotleff Ann M
Bought by
Stuckert Dale E and Stuckert Carol
Purchase Details
Closed on
Jan 1, 1975
Bought by
Drotleff Ann M
Create a Home Valuation Report for This Property
The Home Valuation Report is an in-depth analysis detailing your home's value as well as a comparison with similar homes in the area
Home Values in the Area
Average Home Value in this Area
Purchase History
| Date | Buyer | Sale Price | Title Company |
|---|---|---|---|
| Johnson Lucian E | -- | Attorney | |
| Trust Gene Ra Investments | -- | -- | |
| Johnson Kriss E | $76,900 | -- | |
| Dams Douglas G | $47,900 | -- | |
| Stuckert Dale E | $42,000 | -- | |
| Drotleff Ann M | -- | -- |
Source: Public Records
Mortgage History
| Date | Status | Borrower | Loan Amount |
|---|---|---|---|
| Previous Owner | Johnson Kriss E | $76,900 |
Source: Public Records
Tax History
| Year | Tax Paid | Tax Assessment Tax Assessment Total Assessment is a certain percentage of the fair market value that is determined by local assessors to be the total taxable value of land and additions on the property. | Land | Improvement |
|---|---|---|---|---|
| 2025 | $2,680 | $39,900 | $7,385 | $32,515 |
| 2024 | $2,770 | $39,900 | $7,385 | $32,515 |
| 2023 | $2,687 | $30,950 | $6,410 | $24,540 |
| 2022 | $2,626 | $30,940 | $6,410 | $24,540 |
| 2021 | $2,924 | $30,940 | $6,410 | $24,540 |
| 2020 | $2,773 | $26,670 | $5,530 | $21,140 |
| 2019 | $2,492 | $76,200 | $15,800 | $60,400 |
| 2018 | $2,484 | $26,670 | $5,530 | $21,140 |
| 2017 | $2,659 | $23,560 | $3,990 | $19,570 |
| 2016 | $2,665 | $23,560 | $3,990 | $19,570 |
| 2015 | $2,427 | $23,560 | $3,990 | $19,570 |
| 2014 | $2,427 | $23,560 | $3,990 | $19,570 |
Source: Public Records
Map
Nearby Homes
- 20021 Green Oak Dr
- 1732 Glenridge Rd
- 1721 Grand Blvd
- 24 Washington Square Unit 15
- 19871 Upper Valley Dr
- 1566 E 195th St
- 19201 Shawnee Rd
- 19201 Genesee Rd
- 19151 Genesee Rd
- 22601 Harms Rd
- 2010 E 226th St
- 209 Greenbriar Ct
- 22791 Harms Rd
- 2017 Natona Rd
- 1545 E 214th St
- 19210 Firwood Rd
- 21950 Euclid Ave
- 18079 Blandford Rd
- 1554 E 221st St
- 1514 Clermont Rd
- 20151 Champ Dr
- 20171 Champ Dr
- 20131 Champ Dr
- 20191 Champ Dr
- 20160 Green Oak Dr
- 20121 Champ Dr
- 20150 Green Oak Dr
- 20190 Green Oak Dr
- 20101 Champ Dr
- 20200 Green Oak Dr
- 20120 Green Oak Dr
- 1884 Glenridge Rd
- 1890 Glenridge Rd
- 1870 Glenridge Rd
- 20114 Champ Dr
- 1850 Glenridge Rd
- 1894 Glenridge Rd
- 1840 Glenridge Rd
- 20100 Green Oak Dr
- 20091 Champ Dr
Your Personal Tour Guide
Ask me questions while you tour the home.