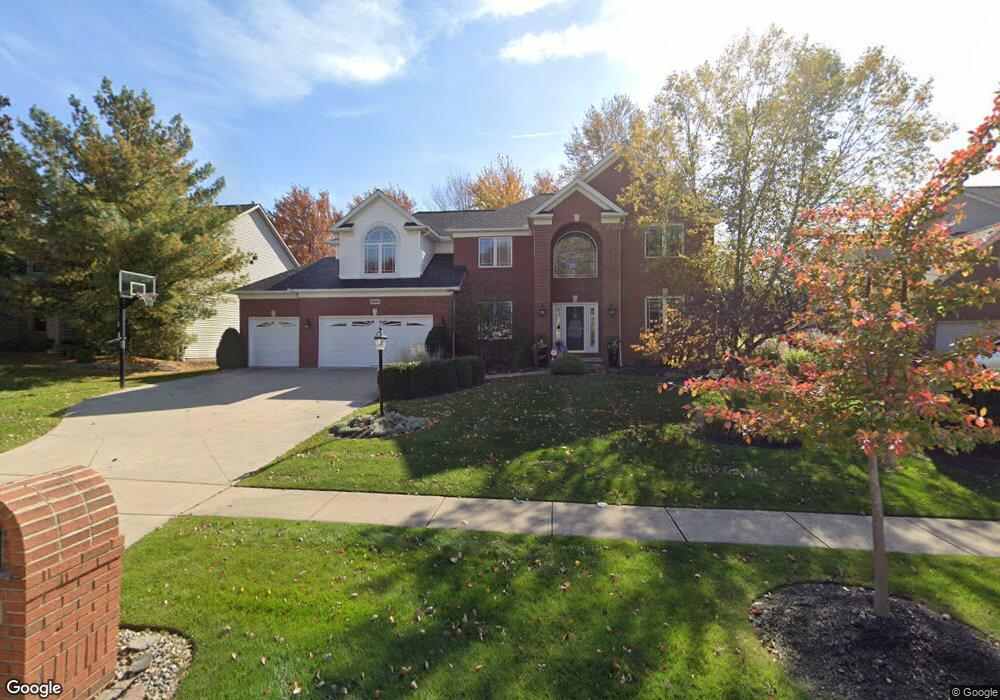
20167 Kylemore Dr Strongsville, OH 44149
Estimated Value: $573,646 - $644,000
4
Beds
4
Baths
3,742
Sq Ft
$164/Sq Ft
Est. Value
About This Home
This home is located at 20167 Kylemore Dr, Strongsville, OH 44149 and is currently estimated at $613,162, approximately $163 per square foot. 20167 Kylemore Dr is a home located in Cuyahoga County with nearby schools including Strongsville High School, Strongsville Academy, and Strongsville Montessori School.
Ownership History
Date
Name
Owned For
Owner Type
Purchase Details
Closed on
Mar 31, 2008
Sold by
Prudential Relocation Inc
Bought by
Midea Anthony Cosmo
Current Estimated Value
Purchase Details
Closed on
Mar 25, 2008
Sold by
Schrader Kerry E and Schrader Gerald L
Bought by
Prudential Relocation Inc
Purchase Details
Closed on
May 25, 2005
Sold by
Newman Ronald T and Newman Nicole M Rye
Bought by
Schrader Gerald L and Schrader Kerry E
Home Financials for this Owner
Home Financials are based on the most recent Mortgage that was taken out on this home.
Original Mortgage
$290,000
Interest Rate
4.87%
Mortgage Type
Purchase Money Mortgage
Purchase Details
Closed on
Feb 8, 2001
Sold by
Ream Bldrs
Bought by
Newman Ronald T and Newman Nicole M Rye
Home Financials for this Owner
Home Financials are based on the most recent Mortgage that was taken out on this home.
Original Mortgage
$130,000
Interest Rate
7.1%
Create a Home Valuation Report for This Property
The Home Valuation Report is an in-depth analysis detailing your home's value as well as a comparison with similar homes in the area
Home Values in the Area
Average Home Value in this Area
Purchase History
| Date | Buyer | Sale Price | Title Company |
|---|---|---|---|
| Midea Anthony Cosmo | $340,000 | Chicago Title Insurance Co | |
| Prudential Relocation Inc | $355,000 | Chicago Title Insurance Co | |
| Schrader Gerald L | $409,000 | Northstar Title Agency | |
| Newman Ronald T | $338,000 | -- |
Source: Public Records
Mortgage History
| Date | Status | Borrower | Loan Amount |
|---|---|---|---|
| Previous Owner | Schrader Gerald L | $290,000 | |
| Previous Owner | Newman Ronald T | $130,000 |
Source: Public Records
Tax History Compared to Growth
Tax History
| Year | Tax Paid | Tax Assessment Tax Assessment Total Assessment is a certain percentage of the fair market value that is determined by local assessors to be the total taxable value of land and additions on the property. | Land | Improvement |
|---|---|---|---|---|
| 2024 | $7,973 | $169,820 | $32,795 | $137,025 |
| 2023 | $8,716 | $139,200 | $35,420 | $103,780 |
| 2022 | $8,653 | $139,200 | $35,420 | $103,780 |
| 2021 | $8,584 | $139,200 | $35,420 | $103,780 |
| 2020 | $9,155 | $131,320 | $33,430 | $97,900 |
| 2019 | $8,886 | $375,200 | $95,500 | $279,700 |
| 2018 | $8,065 | $131,320 | $33,430 | $97,900 |
| 2017 | $8,227 | $124,010 | $27,480 | $96,530 |
| 2016 | $8,160 | $124,010 | $27,480 | $96,530 |
| 2015 | $7,733 | $124,010 | $27,480 | $96,530 |
| 2014 | $7,733 | $115,890 | $25,690 | $90,200 |
Source: Public Records
Map
Nearby Homes
- 19292 Charter Ln
- 20595 Morar Cir
- 20086 Bradgate Ln
- 21015 Park Ridge Crossing Unit 31
- The Parkside Plan at Park Ridge Crossings
- The Prescott Plan at Park Ridge Crossings
- The Baldwin Plan at Park Ridge Crossings
- The Winchester Plan at Park Ridge Crossings
- The Berkley Plan at Park Ridge Crossings
- The Forestwood Plan at Park Ridge Crossings
- The Bexley 55 Plan at Park Ridge Crossings
- The Mahogony III Plan at Park Ridge Crossings
- The Hampton II Plan at Park Ridge Crossings
- The Bexley III Plan at Park Ridge Crossings
- The Heritage II Plan at Park Ridge Crossings - Hidden Creek Villas
- The Hamilton IV Plan at Park Ridge Crossings - Hidden Creek Villas
- The Hamilton II Plan at Park Ridge Crossings - Hidden Creek Villas
- The Heritage Plan at Park Ridge Crossings - Hidden Creek Villas
- The Edgerton Plan at Park Ridge Crossings - Hidden Creek Villas
- The Hamilton Plan at Park Ridge Crossings - Hidden Creek Villas
- 20143 Kylemore Dr
- 20191 Kylemore Dr
- 20098 Lismore Ct
- 20076 Lismore Ct
- 20120 Lismore Ct
- 20215 Kylemore Dr
- 20054 Lismore Ct
- 20142 Lismore Ct
- 20180 Kylemore Dr
- 20204 Kylemore Dr
- 20156 Kylemore Dr
- 20164 Lismore Ct
- 20239 Kylemore Dr
- 20228 Kylemore Dr
- 20095 Kylemore Dr
- 19191 Erin Cir
- 20186 Lismore Ct
- 20109 Lismore Ct
- 20087 Lismore Ct
- 20131 Lismore Ct