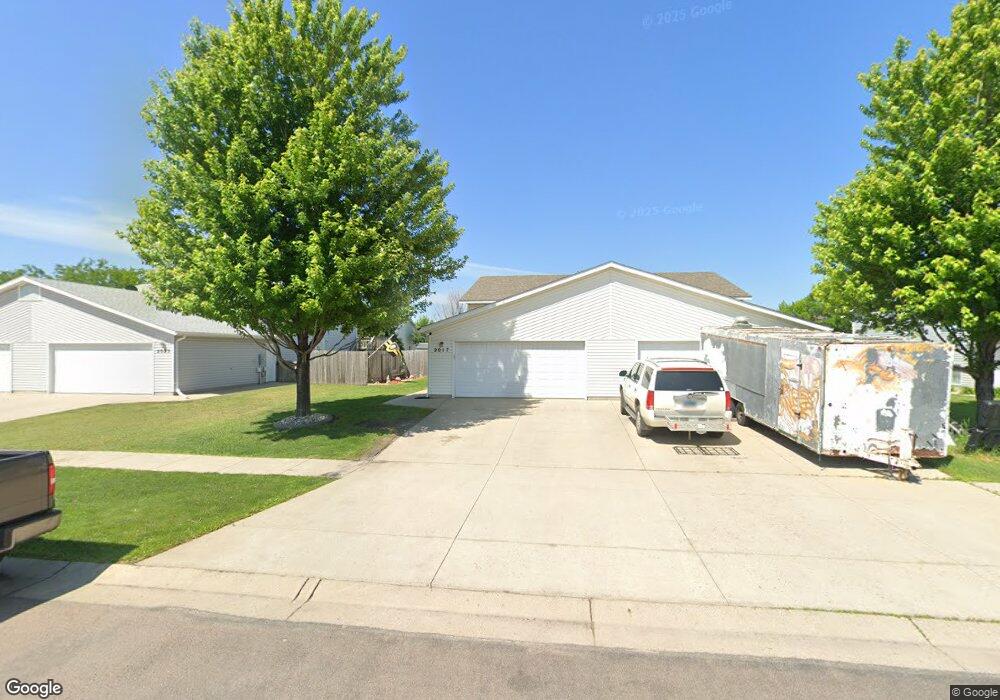
2017 50th St S Fargo, ND 58103
Willow Park NeighborhoodEstimated Value: $233,000 - $269,000
3
Beds
2
Baths
1,678
Sq Ft
$153/Sq Ft
Est. Value
About This Home
This home is located at 2017 50th St S, Fargo, ND 58103 and is currently estimated at $256,279, approximately $152 per square foot. 2017 50th St S is a home located in Cass County with nearby schools including Eastwood Elementary School, Cheney Middle School, and West Fargo High School.
Ownership History
Date
Name
Owned For
Owner Type
Purchase Details
Closed on
Nov 8, 2019
Sold by
Perkins David F
Bought by
Perkins David F and Perkins Revocable Livi David F
Current Estimated Value
Purchase Details
Closed on
Jan 27, 2012
Sold by
Hintzman Karen K
Bought by
Perkins David F and Perkins Randall J
Home Financials for this Owner
Home Financials are based on the most recent Mortgage that was taken out on this home.
Original Mortgage
$100,000
Interest Rate
3.93%
Mortgage Type
New Conventional
Purchase Details
Closed on
Apr 15, 2011
Sold by
Kinneberg Pamlea J and Olson Terry A
Bought by
Hirtzman Karen K
Home Financials for this Owner
Home Financials are based on the most recent Mortgage that was taken out on this home.
Original Mortgage
$106,400
Interest Rate
4.77%
Mortgage Type
New Conventional
Purchase Details
Closed on
Oct 28, 2005
Sold by
Feldner Shawn R and Feldner Michele E
Bought by
Kinnenberg Pamela J
Home Financials for this Owner
Home Financials are based on the most recent Mortgage that was taken out on this home.
Original Mortgage
$120,555
Interest Rate
5.98%
Mortgage Type
New Conventional
Create a Home Valuation Report for This Property
The Home Valuation Report is an in-depth analysis detailing your home's value as well as a comparison with similar homes in the area
Home Values in the Area
Average Home Value in this Area
Purchase History
| Date | Buyer | Sale Price | Title Company |
|---|---|---|---|
| Perkins David F | -- | None Available | |
| Perkins Randall J | -- | None Available | |
| Perkins Randall J | -- | None Available | |
| Perkins David F | $125,000 | None Available | |
| Hirtzman Karen K | -- | -- | |
| Kinnenberg Pamela J | -- | -- |
Source: Public Records
Mortgage History
| Date | Status | Borrower | Loan Amount |
|---|---|---|---|
| Previous Owner | Perkins David F | $100,000 | |
| Previous Owner | Hirtzman Karen K | $106,400 | |
| Previous Owner | Kinnenberg Pamela J | $120,555 |
Source: Public Records
Tax History Compared to Growth
Tax History
| Year | Tax Paid | Tax Assessment Tax Assessment Total Assessment is a certain percentage of the fair market value that is determined by local assessors to be the total taxable value of land and additions on the property. | Land | Improvement |
|---|---|---|---|---|
| 2024 | $2,957 | $114,150 | $20,550 | $93,600 |
| 2023 | $2,600 | $103,800 | $17,550 | $86,250 |
| 2022 | $2,434 | $92,700 | $17,550 | $75,150 |
| 2021 | $2,365 | $89,150 | $17,550 | $71,600 |
| 2020 | $2,215 | $84,900 | $17,550 | $67,350 |
| 2019 | $2,140 | $82,450 | $9,750 | $72,700 |
| 2018 | $2,017 | $81,200 | $9,750 | $71,450 |
| 2017 | $1,909 | $78,850 | $9,750 | $69,100 |
| 2016 | $1,727 | $76,550 | $9,750 | $66,800 |
| 2015 | $1,629 | $69,100 | $7,300 | $61,800 |
| 2014 | $1,569 | $64,000 | $7,300 | $56,700 |
| 2013 | $1,567 | $64,000 | $7,300 | $56,700 |
Source: Public Records
Map
Nearby Homes
- 1970 Burlington Dr
- 1842 52nd St S
- 1859 13th St E
- 1829 13th St E
- 1534 Baywood Dr
- 1522 Baywood Dr
- 1836 12th St E
- 1845 Huntington Ct
- 4470 24th Ave S Unit 703
- 4470 24th Ave S Unit 604
- 4470 24th Ave S Unit 303
- 4470 24th Ave S Unit 606
- 4470 24th Ave S Unit 602
- 4470 24th Ave S Unit 301
- 4470 24th Ave S Unit 302
- 4470 24th Ave S Unit 502
- 4470 24th Ave S Unit 603
- 4470 24th Ave S Unit 506
- 4470 24th Ave S Unit 601
- 4470 24th Ave S Unit 305