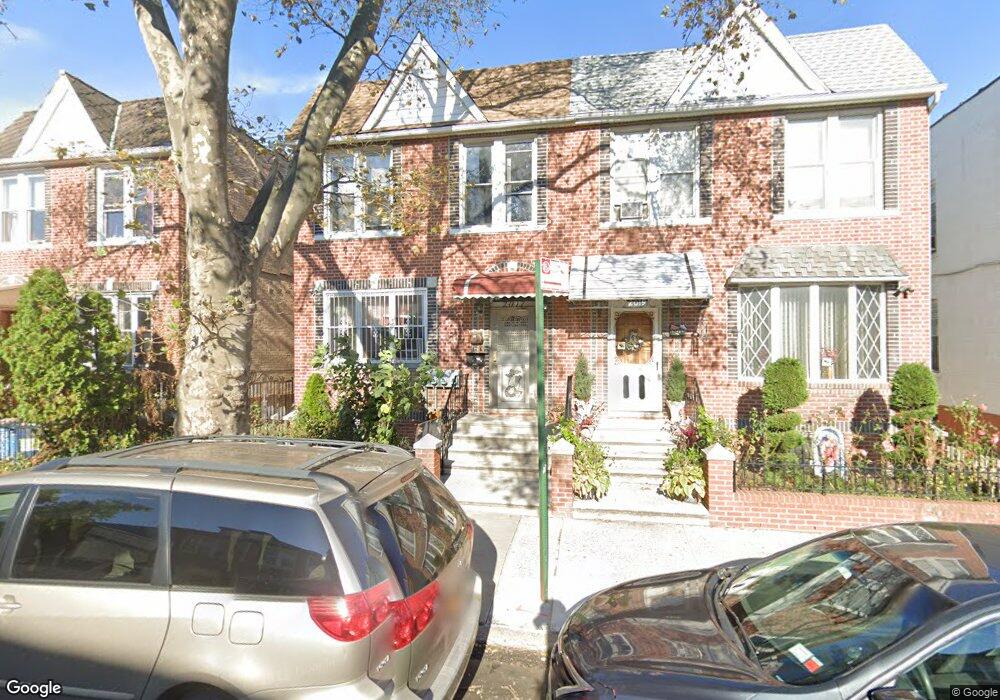
2017 74th St Brooklyn, NY 11204
Bensonhurst NeighborhoodEstimated Value: $1,330,121 - $2,762,000
Studio
--
Bath
2,640
Sq Ft
$706/Sq Ft
Est. Value
About This Home
This home is located at 2017 74th St, Brooklyn, NY 11204 and is currently estimated at $1,864,030, approximately $706 per square foot. 2017 74th St is a home located in Kings County with nearby schools including P.S. 247 The College Partnership Elementary School, Seth Low Intermediate School 96, and James Madison High School.
Ownership History
Date
Name
Owned For
Owner Type
Purchase Details
Closed on
Aug 2, 2013
Sold by
Huang Cheng Pan and Yang Chun Xia
Bought by
Huang Cheng Pan and Huang Yong Hang
Current Estimated Value
Purchase Details
Closed on
Jun 16, 2006
Sold by
Kong Chin Ting
Bought by
Huang Cheng Pan and Yang Chun Xia
Home Financials for this Owner
Home Financials are based on the most recent Mortgage that was taken out on this home.
Original Mortgage
$499,000
Interest Rate
6.6%
Mortgage Type
Purchase Money Mortgage
Purchase Details
Closed on
Dec 4, 2003
Sold by
Ricciardi Louisa
Bought by
Kong Chin Ting
Home Financials for this Owner
Home Financials are based on the most recent Mortgage that was taken out on this home.
Original Mortgage
$340,000
Interest Rate
5.83%
Mortgage Type
Purchase Money Mortgage
Create a Home Valuation Report for This Property
The Home Valuation Report is an in-depth analysis detailing your home's value as well as a comparison with similar homes in the area
Home Values in the Area
Average Home Value in this Area
Purchase History
| Date | Buyer | Sale Price | Title Company |
|---|---|---|---|
| Huang Cheng Pan | -- | -- | |
| Huang Cheng Pan | $725,000 | -- | |
| Kong Chin Ting | $580,000 | -- |
Source: Public Records
Mortgage History
| Date | Status | Borrower | Loan Amount |
|---|---|---|---|
| Previous Owner | Huang Cheng Pan | $499,000 | |
| Previous Owner | Kong Chin Ting | $340,000 |
Source: Public Records
Tax History
| Year | Tax Paid | Tax Assessment Tax Assessment Total Assessment is a certain percentage of the fair market value that is determined by local assessors to be the total taxable value of land and additions on the property. | Land | Improvement |
|---|---|---|---|---|
| 2025 | $10,213 | $82,620 | $14,700 | $67,920 |
| 2024 | $10,213 | $92,340 | $14,700 | $77,640 |
| 2023 | $9,743 | $96,720 | $14,700 | $82,020 |
| 2022 | $6,795 | $85,200 | $14,700 | $70,500 |
| 2021 | $9,383 | $91,800 | $14,700 | $77,100 |
| 2020 | $4,664 | $85,140 | $14,700 | $70,440 |
| 2019 | $8,864 | $85,140 | $14,700 | $70,440 |
| 2018 | $8,150 | $39,978 | $8,691 | $31,287 |
| 2017 | $7,710 | $37,821 | $7,589 | $30,232 |
| 2016 | $7,428 | $37,156 | $8,564 | $28,592 |
| 2015 | $4,303 | $37,156 | $11,498 | $25,658 |
| 2014 | $4,303 | $35,312 | $11,407 | $23,905 |
Source: Public Records
Map
Nearby Homes
Your Personal Tour Guide
Ask me questions while you tour the home.