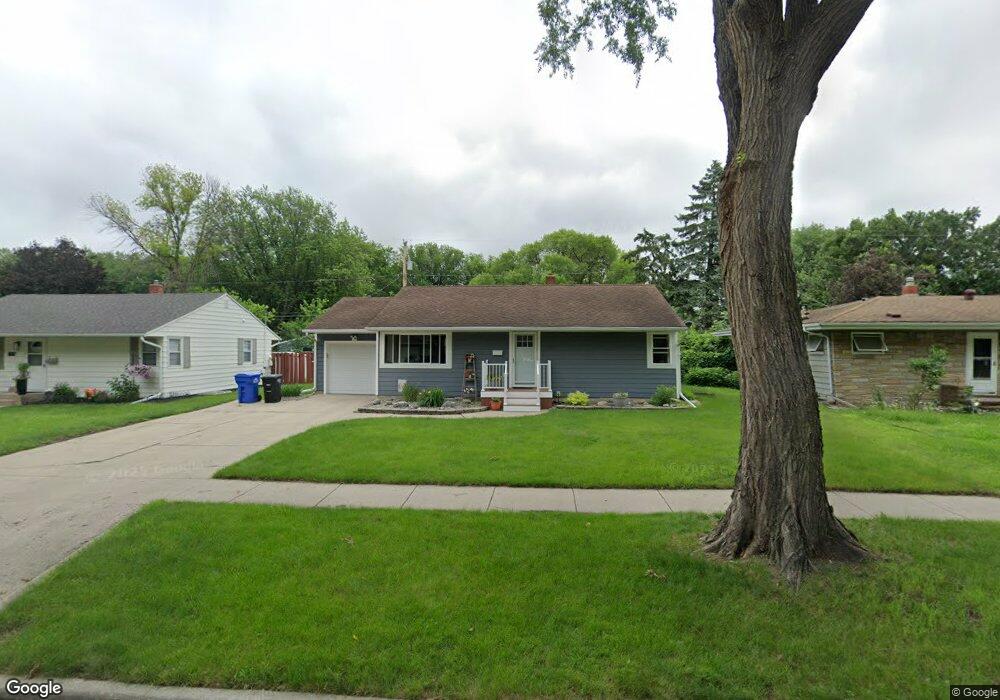
2017 9th St N Fargo, ND 58102
Northport NeighborhoodEstimated Value: $256,000 - $272,000
3
Beds
2
Baths
1,926
Sq Ft
$138/Sq Ft
Est. Value
About This Home
This home is located at 2017 9th St N, Fargo, ND 58102 and is currently estimated at $264,994, approximately $137 per square foot. 2017 9th St N is a home located in Cass County with nearby schools including Washington Elementary School, Ben Franklin Middle School, and North High School.
Ownership History
Date
Name
Owned For
Owner Type
Purchase Details
Closed on
Aug 5, 2017
Sold by
Caven Timothy G and Timothy G Caven Revocable Trus
Bought by
Eddleston Anthony C and Eddleston Anthony C
Current Estimated Value
Home Financials for this Owner
Home Financials are based on the most recent Mortgage that was taken out on this home.
Original Mortgage
$164,700
Outstanding Balance
$137,429
Interest Rate
3.96%
Mortgage Type
New Conventional
Estimated Equity
$127,565
Purchase Details
Closed on
Oct 9, 2015
Sold by
Caven Timothy G and Caven Nancy D
Bought by
Caven Timothy G and Timothy G Caven Revocable Trus
Purchase Details
Closed on
Apr 15, 2011
Sold by
Kading Jenny A and Kading Joshua D
Bought by
Caven Timothy G and Caven Nancy D
Purchase Details
Closed on
May 29, 2008
Sold by
Holman Scott M and Holman Scott Michael
Bought by
Kading Joshua D and Kading Jenny A
Home Financials for this Owner
Home Financials are based on the most recent Mortgage that was taken out on this home.
Original Mortgage
$126,100
Interest Rate
5.93%
Mortgage Type
New Conventional
Purchase Details
Closed on
Jun 21, 2007
Sold by
Holman Lisa Michelle
Bought by
Holman Scott Michael and Holman Scott M
Home Financials for this Owner
Home Financials are based on the most recent Mortgage that was taken out on this home.
Original Mortgage
$97,500
Interest Rate
6.42%
Mortgage Type
New Conventional
Create a Home Valuation Report for This Property
The Home Valuation Report is an in-depth analysis detailing your home's value as well as a comparison with similar homes in the area
Home Values in the Area
Average Home Value in this Area
Purchase History
| Date | Buyer | Sale Price | Title Company |
|---|---|---|---|
| Eddleston Anthony C | $183,000 | Trn Abstract & Title | |
| Caven Timothy G | -- | None Available | |
| Caven Timothy G | -- | -- | |
| Kading Joshua D | -- | -- | |
| Holman Scott Michael | -- | -- |
Source: Public Records
Mortgage History
| Date | Status | Borrower | Loan Amount |
|---|---|---|---|
| Open | Eddleston Anthony C | $164,700 | |
| Previous Owner | Kading Joshua D | $126,100 | |
| Previous Owner | Holman Scott Michael | $97,500 |
Source: Public Records
Tax History
| Year | Tax Paid | Tax Assessment Tax Assessment Total Assessment is a certain percentage of the fair market value that is determined by local assessors to be the total taxable value of land and additions on the property. | Land | Improvement |
|---|---|---|---|---|
| 2024 | $3,062 | $120,950 | $27,000 | $93,950 |
| 2023 | $3,362 | $114,100 | $27,000 | $87,100 |
| 2022 | $3,237 | $107,650 | $27,000 | $80,650 |
| 2021 | $3,100 | $104,500 | $27,000 | $77,500 |
| 2020 | $2,739 | $97,650 | $27,000 | $70,650 |
| 2019 | $2,616 | $97,650 | $15,000 | $82,650 |
| 2018 | $2,038 | $76,700 | $15,000 | $61,700 |
| 2017 | $1,959 | $74,450 | $15,000 | $59,450 |
| 2016 | $1,776 | $67,700 | $15,000 | $52,700 |
| 2015 | $1,891 | $67,700 | $11,250 | $56,450 |
| 2014 | $2,158 | $76,050 | $11,250 | $64,800 |
| 2013 | $2,075 | $72,450 | $11,250 | $61,200 |
Source: Public Records
Map
Nearby Homes
- 2001 8th St N
- 801 17th Ave N
- 2501 9th St N
- 1830 4th St N
- 301 21st Ave N
- 3216 Broadway N
- 306 25th Ave N
- 1647 Broadway N
- 1630 7th St N
- 1625 11th St N
- 1613 10th St N
- 2814 10th St N
- 1626 11th St N
- 105 24th Ave N
- 77 18th Ave N
- 2807 Edgewood Dr N
- 1441 Broadway N Unit 203
- 1451 12th St N
- 1437 Broadway N Unit 101
- 3110 Broadway N
Your Personal Tour Guide
Ask me questions while you tour the home.