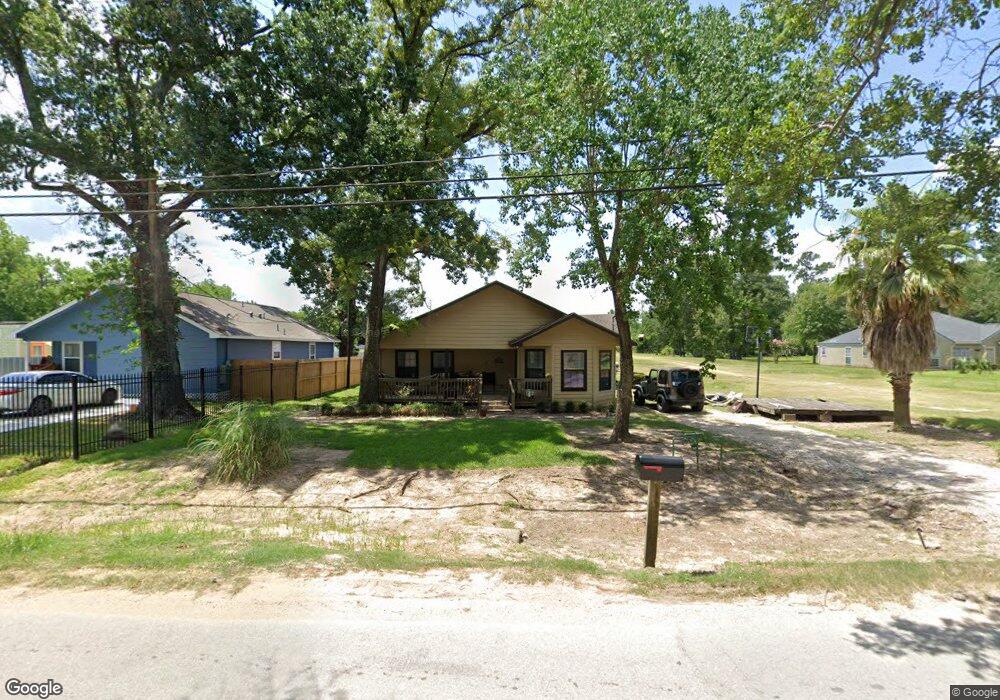
2017 De Soto St Houston, TX 77091
Acres Homes NeighborhoodEstimated Value: $358,000 - $504,000
3
Beds
1
Bath
2,134
Sq Ft
$208/Sq Ft
Est. Value
About This Home
This home is located at 2017 De Soto St, Houston, TX 77091 and is currently estimated at $444,786, approximately $208 per square foot. 2017 De Soto St is a home located in Harris County with nearby schools including Reece Academy, Anderson Academy, and Drew Academy.
Ownership History
Date
Name
Owned For
Owner Type
Purchase Details
Closed on
Nov 28, 2018
Sold by
Anderson Keith
Bought by
Anderson Brenda Faye
Current Estimated Value
Purchase Details
Closed on
Oct 25, 2007
Sold by
Advantage House Buyers Inc
Bought by
Anderson Keith
Home Financials for this Owner
Home Financials are based on the most recent Mortgage that was taken out on this home.
Original Mortgage
$104,510
Outstanding Balance
$65,618
Interest Rate
6.32%
Mortgage Type
FHA
Estimated Equity
$379,168
Purchase Details
Closed on
Jan 24, 2007
Sold by
Johnson Herbert Winston
Bought by
Advantage House Buyers Inc
Home Financials for this Owner
Home Financials are based on the most recent Mortgage that was taken out on this home.
Original Mortgage
$1,000,000
Interest Rate
6.1%
Mortgage Type
Purchase Money Mortgage
Create a Home Valuation Report for This Property
The Home Valuation Report is an in-depth analysis detailing your home's value as well as a comparison with similar homes in the area
Home Values in the Area
Average Home Value in this Area
Purchase History
| Date | Buyer | Sale Price | Title Company |
|---|---|---|---|
| Anderson Brenda Faye | -- | None Available | |
| Anderson Keith | -- | Ameripoint Title | |
| Advantage House Buyers Inc | -- | Ameripoint Title |
Source: Public Records
Mortgage History
| Date | Status | Borrower | Loan Amount |
|---|---|---|---|
| Open | Anderson Keith | $104,510 | |
| Previous Owner | Advantage House Buyers Inc | $1,000,000 |
Source: Public Records
Tax History Compared to Growth
Tax History
| Year | Tax Paid | Tax Assessment Tax Assessment Total Assessment is a certain percentage of the fair market value that is determined by local assessors to be the total taxable value of land and additions on the property. | Land | Improvement |
|---|---|---|---|---|
| 2025 | $2,881 | $470,796 | $393,116 | $77,680 |
| 2024 | $2,881 | $471,057 | $393,116 | $77,941 |
| 2023 | $2,881 | $408,172 | $341,840 | $66,332 |
| 2022 | $3,813 | $291,939 | $213,650 | $78,289 |
| 2021 | $3,630 | $242,572 | $170,920 | $71,652 |
| 2020 | $3,468 | $177,776 | $106,825 | $70,951 |
| 2019 | $3,305 | $158,217 | $106,825 | $51,392 |
| 2018 | $1,200 | $121,362 | $72,641 | $48,721 |
| 2017 | $2,618 | $121,362 | $72,641 | $48,721 |
| 2016 | $2,380 | $106,052 | $64,095 | $41,957 |
| 2015 | -- | $106,052 | $64,095 | $41,957 |
| 2014 | -- | $92,301 | $40,594 | $51,707 |
Source: Public Records
Map
Nearby Homes
- 2142 De Soto St
- 5935 Cebra St
- 0 Golden Forest Unit 21936572
- 00 Wilburforce St
- 0 Homer Ln Unit 73959644
- 6516 Wilburforce St
- 5939 Cebra St
- 5937 Cebra St
- 5933 Cebra St
- 1825 De Soto St
- 5918 Manning Oaks St
- 6417 Lamayah St
- 6407 Lamayah St
- 6431 Lamayah St
- 00 Bayou View Dr
- 6425 Lamayah St
- 6413 Lamayah St
- 6415 Lamayah St
- 2120 Mansfield
- 2210 Mansfield St
- 2005 De Soto St
- 2003 De Soto St
- 2003 De Soto St
- 2035 De Soto St
- 2025 De Soto St
- 2125 De Soto St
- 1929 De Soto St
- 2018 De Soto St
- 1938 De Soto St
- 2119 De Soto St
- 2102 De Soto St
- 2002 De Soto St
- 1925 De Soto St
- 2022 De Soto St
- 2127 De Soto St
- 2114 De Soto St
- 2128 De Soto St
- 2131 De Soto St
- 2140 De Soto St
- 1901 De Soto St