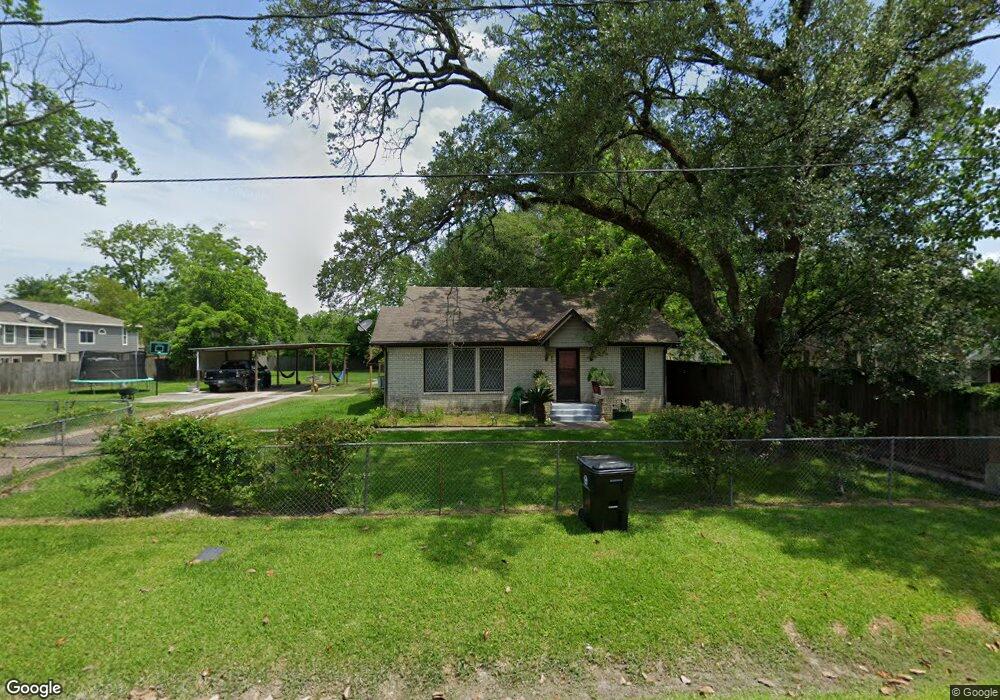
2017 Eubanks St Unit 1 Houston, TX 77093
Eastex-Jensen NeighborhoodEstimated Value: $253,000 - $290,000
4
Beds
2
Baths
1,474
Sq Ft
$178/Sq Ft
Est. Value
About This Home
This home is located at 2017 Eubanks St Unit 1, Houston, TX 77093 and is currently estimated at $262,545, approximately $178 per square foot. 2017 Eubanks St Unit 1 is a home located in Harris County with nearby schools including Berry Elementary School, Patrick Henry Middle School, and Kashmere High School.
Ownership History
Date
Name
Owned For
Owner Type
Purchase Details
Closed on
Jul 23, 2024
Sold by
Sparrow Assisted Living Ii Inc
Bought by
Azelene Homes Llc
Current Estimated Value
Purchase Details
Closed on
Mar 18, 2011
Sold by
Proctor Freddie A
Bought by
One To Four Family Residential Contract
Purchase Details
Closed on
Mar 10, 2011
Sold by
Relford Mark A
Bought by
Proctor Freddie A
Purchase Details
Closed on
Apr 7, 2009
Sold by
Proctor Freddie A
Bought by
Relford Mark A
Purchase Details
Closed on
Jun 8, 2004
Sold by
Dubley Maria Antwinette and Dubley Ray Don
Bought by
Proctor Freddie A
Home Financials for this Owner
Home Financials are based on the most recent Mortgage that was taken out on this home.
Original Mortgage
$61,250
Interest Rate
6.12%
Mortgage Type
Stand Alone First
Purchase Details
Closed on
Jun 17, 2002
Sold by
Proctor Freddie A
Bought by
Proctor Freddie A
Create a Home Valuation Report for This Property
The Home Valuation Report is an in-depth analysis detailing your home's value as well as a comparison with similar homes in the area
Home Values in the Area
Average Home Value in this Area
Purchase History
| Date | Buyer | Sale Price | Title Company |
|---|---|---|---|
| Azelene Homes Llc | -- | None Listed On Document | |
| One To Four Family Residential Contract | $75,000 | None Available | |
| Proctor Freddie A | $75,000 | None Available | |
| Relford Mark A | -- | None Available | |
| Proctor Freddie A | -- | Startex Title Company | |
| Proctor Freddie A | -- | -- | |
| Proctor Freddie A | -- | -- |
Source: Public Records
Mortgage History
| Date | Status | Borrower | Loan Amount |
|---|---|---|---|
| Previous Owner | Proctor Freddie A | $61,250 |
Source: Public Records
Tax History
| Year | Tax Paid | Tax Assessment Tax Assessment Total Assessment is a certain percentage of the fair market value that is determined by local assessors to be the total taxable value of land and additions on the property. | Land | Improvement |
|---|---|---|---|---|
| 2025 | $5,256 | $249,100 | $150,000 | $99,100 |
| 2024 | $5,256 | $251,184 | $150,000 | $101,184 |
| 2023 | $5,256 | $251,184 | $150,000 | $101,184 |
| 2022 | $4,625 | $210,060 | $126,000 | $84,060 |
| 2021 | $3,942 | $169,136 | $96,000 | $73,136 |
| 2020 | $3,915 | $161,684 | $96,000 | $65,684 |
| 2019 | $3,100 | $122,527 | $72,000 | $50,527 |
| 2018 | $2,345 | $92,655 | $48,000 | $44,655 |
| 2017 | $2,343 | $92,655 | $48,000 | $44,655 |
| 2016 | $2,343 | $92,655 | $48,000 | $44,655 |
| 2015 | $2,317 | $78,826 | $36,000 | $42,826 |
| 2014 | $2,317 | $90,140 | $36,000 | $54,140 |
Source: Public Records
Map
Nearby Homes
- 2418 Deams St
- 1815 Eubanks St
- 1817 Mcdaniel St
- 2017 Sadler St
- 2610 Huntington Creek Ln
- 2413 E Crosstimbers St
- 7722 West St
- 2608 Bostic St
- 7718 Duncan St
- 2602 E Crosstimbers St
- 8109 W Hardy Rd
- 8718 Brannon St
- 2821 E Crosstimbers St
- 2609 Eva St
- 2940 Sadler St
- 2120 Vance St
- 3008 Bostic St
- 7305 Jensen
- 7209 Eugene St
- 1115 Post St
- 2017 Eubanks St
- 2021 Eubanks St
- 2013 Eubanks St
- 2013 Eubanks St Unit 8
- 2013 Eubanks St Unit 3
- 2013 Eubanks St Unit 9
- 2013 Eubanks St Unit 5
- 2013 Eubanks St Unit 7
- 2014 Deams St
- 1931 Eubanks St
- 2027 Eubanks St
- 2010 Deams St
- 2018 Deams St
- 1927 Eubanks St
- 2022 Deams St
- 2028 Eubanks St
- 2400 Persimmon St
- 2004 Deams St
- 2030 Deams St
- 2014 Eubanks St
Your Personal Tour Guide
Ask me questions while you tour the home.