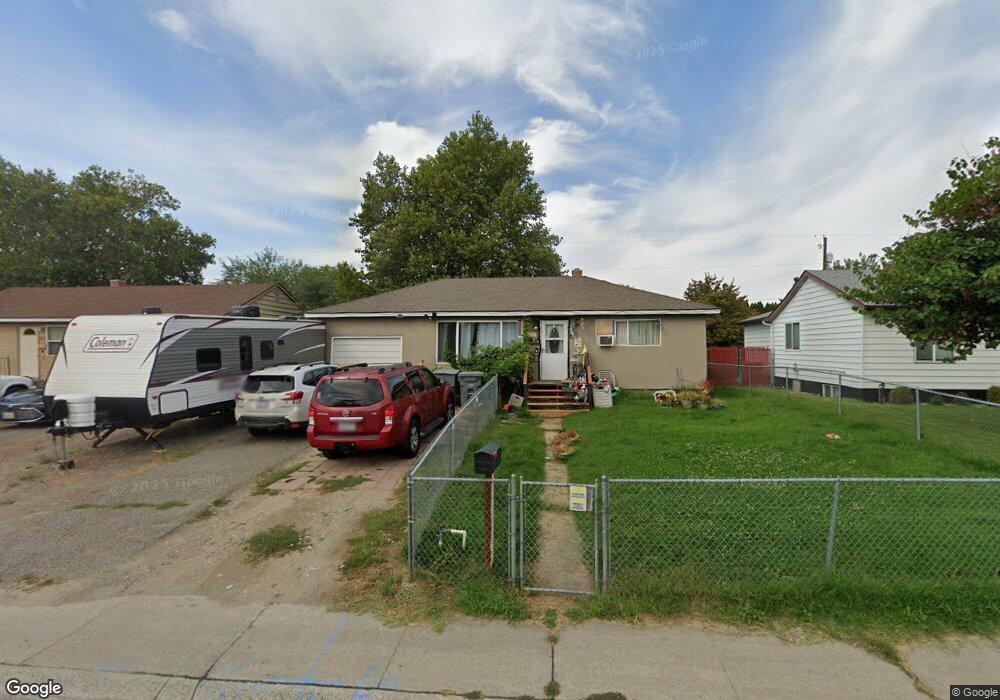
2017 George Washington Way Richland, WA 99354
Estimated Value: $245,000 - $377,000
2
Beds
2
Baths
1,536
Sq Ft
$209/Sq Ft
Est. Value
About This Home
This home is located at 2017 George Washington Way, Richland, WA 99354 and is currently estimated at $321,729, approximately $209 per square foot. 2017 George Washington Way is a home located in Benton County with nearby schools including Sacajawea Elementary School, Chief Joseph Middle School, and Hanford High School.
Ownership History
Date
Name
Owned For
Owner Type
Purchase Details
Closed on
Dec 6, 2021
Sold by
Carpenter Cynthia K
Bought by
Carpenter Cynthia K and Gass Gary
Current Estimated Value
Home Financials for this Owner
Home Financials are based on the most recent Mortgage that was taken out on this home.
Original Mortgage
$175,010
Outstanding Balance
$161,028
Interest Rate
3.14%
Mortgage Type
FHA
Estimated Equity
$160,701
Purchase Details
Closed on
Apr 1, 2009
Sold by
Croskrey David J and Croskrey Nathan R
Bought by
Carpenter Cynthia K
Home Financials for this Owner
Home Financials are based on the most recent Mortgage that was taken out on this home.
Original Mortgage
$7,020
Interest Rate
5.04%
Mortgage Type
Stand Alone Second
Purchase Details
Closed on
Oct 24, 2008
Sold by
The Bank Of New York Trust Company Na
Bought by
Croskrey David J and Croskrey Nathan R
Purchase Details
Closed on
May 27, 2008
Sold by
Burns Jamie
Bought by
The Bank Of New York Trust Co Na
Create a Home Valuation Report for This Property
The Home Valuation Report is an in-depth analysis detailing your home's value as well as a comparison with similar homes in the area
Home Values in the Area
Average Home Value in this Area
Purchase History
| Date | Buyer | Sale Price | Title Company |
|---|---|---|---|
| Carpenter Cynthia K | -- | Chicago Title | |
| Carpenter Cynthia K | $85,000 | Marshall Title Co | |
| Croskrey David J | $54,900 | Frontier Title & Escrow Co | |
| The Bank Of New York Trust Co Na | $90,987 | Frontier Title & Escrow Co |
Source: Public Records
Mortgage History
| Date | Status | Borrower | Loan Amount |
|---|---|---|---|
| Open | Carpenter Cynthia K | $175,010 | |
| Closed | Carpenter Cynthia K | $7,020 | |
| Closed | Carpenter Cynthia K | $83,460 |
Source: Public Records
Tax History Compared to Growth
Tax History
| Year | Tax Paid | Tax Assessment Tax Assessment Total Assessment is a certain percentage of the fair market value that is determined by local assessors to be the total taxable value of land and additions on the property. | Land | Improvement |
|---|---|---|---|---|
| 2024 | $2,682 | $237,750 | $50,000 | $187,750 |
| 2023 | $2,682 | $284,690 | $50,000 | $234,690 |
| 2022 | $2,336 | $251,170 | $50,000 | $201,170 |
| 2021 | $2,115 | $210,100 | $50,000 | $160,100 |
| 2020 | $1,830 | $182,660 | $50,000 | $132,660 |
| 2019 | $1,454 | $149,060 | $22,400 | $126,660 |
| 2018 | $1,498 | $127,220 | $22,400 | $104,820 |
| 2017 | $1,312 | $109,750 | $22,400 | $87,350 |
| 2016 | $1,293 | $109,750 | $22,400 | $87,350 |
| 2015 | $1,270 | $109,750 | $22,400 | $87,350 |
| 2014 | -- | $105,790 | $22,400 | $83,390 |
| 2013 | -- | $105,790 | $22,400 | $83,390 |
Source: Public Records
Map
Nearby Homes
- 515 Blue St
- 517 Catskill St
- 1923 Hood Ave
- 1947 Hetrick St
- 2110 Davison Ave
- 78 Whitten St
- 324 Saint St
- 1962 Mahan Ave
- 2021 Mahan Ave Unit J-6
- 2021 Mahan Ave Unit D8
- 2021 Mahan Ave Unit A5
- 2021 Mahan Ave Unit I8
- 2021 Mahan Ave Unit H-7
- 2021 Mahan Ave Unit M7
- 2021 Mahan Ave Unit G1
- 1914 Mahan Ave
- 1980 Forest Ave
- 1910 Forest Ave
- 733 Snyder St
- 21 Nuclear Ln
- 2015 George Washington Way
- 2019 George Washington Way
- 2013 George Washington Way
- 2021 George Washington Way
- 2016 Everest Ave
- 2018 Everest Ave
- 2014 Everest Ave
- 2023 George Washington Way
- 2020 Everest Ave
- 2011 George Washington Way
- 2012 Everest Ave
- 2022 Everest Ave
- 2010 Everest Ave
- 2012 George Washington Way
- 2018 George Washington Way Unit Motivated Seller!!!
- 2018 George Washington Way Unit COME ON DOWN, THE PR
- 2018 George Washington Way
- 2009 George Washington Way
- 403 Catskill St
- 2024 George Washington Way