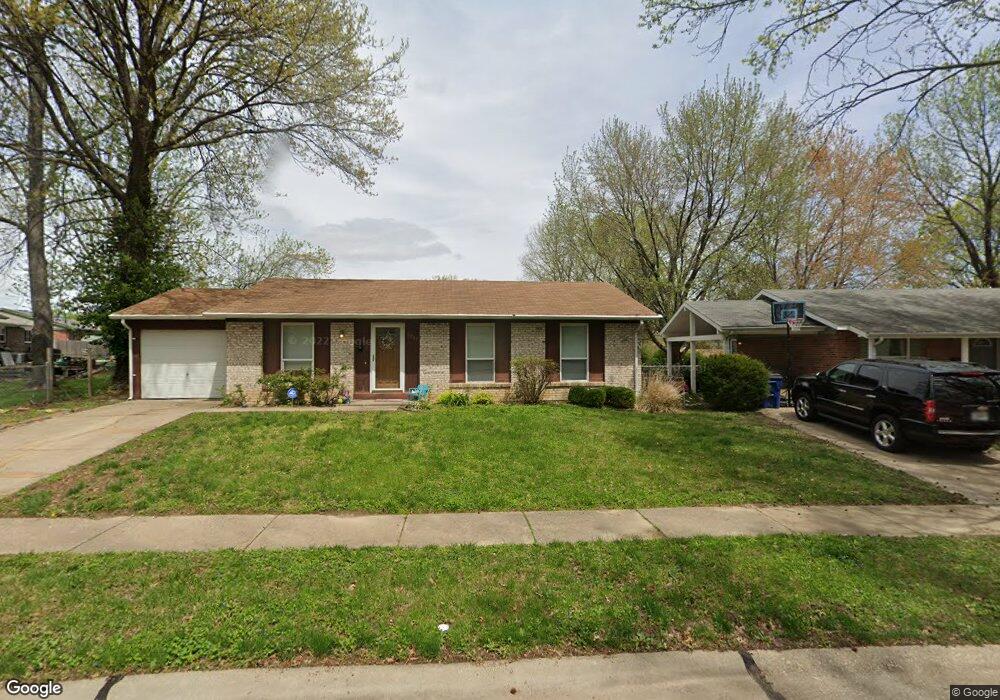
2017 Hungerford Dr Florissant, MO 63031
Estimated Value: $178,382 - $194,000
4
Beds
2
Baths
1,189
Sq Ft
$156/Sq Ft
Est. Value
About This Home
This home is located at 2017 Hungerford Dr, Florissant, MO 63031 and is currently estimated at $185,096, approximately $155 per square foot. 2017 Hungerford Dr is a home located in St. Louis County with nearby schools including Walker Elementary School, Northwest Middle School, and Hazelwood West High School.
Ownership History
Date
Name
Owned For
Owner Type
Purchase Details
Closed on
Dec 21, 2021
Sold by
Woods Amanda L
Bought by
Curry Zannetta and Brown Helen
Current Estimated Value
Home Financials for this Owner
Home Financials are based on the most recent Mortgage that was taken out on this home.
Original Mortgage
$9,559
Outstanding Balance
$8,805
Interest Rate
3.22%
Mortgage Type
FHA
Estimated Equity
$176,291
Purchase Details
Closed on
Nov 14, 2008
Sold by
Beaird Donna M
Bought by
Curry Bridgett M
Home Financials for this Owner
Home Financials are based on the most recent Mortgage that was taken out on this home.
Original Mortgage
$98,850
Interest Rate
5.98%
Mortgage Type
FHA
Purchase Details
Closed on
Jul 21, 2000
Sold by
Steinmann Properties Llc
Bought by
Beaird Raymond W and Beaird Donna M
Home Financials for this Owner
Home Financials are based on the most recent Mortgage that was taken out on this home.
Original Mortgage
$58,300
Interest Rate
8.23%
Purchase Details
Closed on
Jan 1, 1997
Sold by
Steinmann and Karen
Bought by
Steinmann Properties Llc
Create a Home Valuation Report for This Property
The Home Valuation Report is an in-depth analysis detailing your home's value as well as a comparison with similar homes in the area
Home Values in the Area
Average Home Value in this Area
Purchase History
| Date | Buyer | Sale Price | Title Company |
|---|---|---|---|
| Curry Zannetta | -- | Continental Title | |
| Curry Zannetta | -- | Continental Title | |
| Curry Bridgett M | $100,000 | None Available | |
| Beaird Raymond W | $73,900 | -- | |
| Steinmann Properties Llc | -- | -- |
Source: Public Records
Mortgage History
| Date | Status | Borrower | Loan Amount |
|---|---|---|---|
| Open | Curry Zannetta | $9,559 | |
| Closed | Curry Zannetta | $9,559 | |
| Previous Owner | Curry Bridgett M | $98,850 | |
| Previous Owner | Beaird Raymond W | $58,300 |
Source: Public Records
Tax History Compared to Growth
Tax History
| Year | Tax Paid | Tax Assessment Tax Assessment Total Assessment is a certain percentage of the fair market value that is determined by local assessors to be the total taxable value of land and additions on the property. | Land | Improvement |
|---|---|---|---|---|
| 2025 | $2,435 | $30,630 | $5,260 | $25,370 |
| 2024 | $2,435 | $27,830 | $3,000 | $24,830 |
| 2023 | $2,435 | $27,830 | $3,000 | $24,830 |
| 2022 | $2,173 | $22,140 | $3,460 | $18,680 |
| 2021 | $2,142 | $22,140 | $3,460 | $18,680 |
| 2020 | $1,735 | $16,650 | $3,460 | $13,190 |
| 2019 | $1,709 | $16,650 | $3,460 | $13,190 |
| 2018 | $1,700 | $15,230 | $2,390 | $12,840 |
| 2017 | $1,698 | $15,230 | $2,390 | $12,840 |
| 2016 | $1,774 | $15,710 | $2,770 | $12,940 |
| 2015 | $1,736 | $15,710 | $2,770 | $12,940 |
| 2014 | $1,748 | $16,300 | $3,460 | $12,840 |
Source: Public Records
Map
Nearby Homes
- 2540 Courtyard Place
- 2618 Freemantle Dr
- 2235 Central Parkway Dr
- 2106 Kingsford Dr
- 2314 Stoney End Ct
- 2042 Farflung Dr
- 2112 Millvalley Dr
- 2347 Farflung Dr
- 1885 High Sun Dr
- 2390 Wharton Ct
- 2437 Periwinkle Ct
- 1907 High Sun Dr
- 1831 New Sun Ct Unit 5
- 2112 New Sun Dr
- 1863 High Sun Dr Unit 51863
- 1920 Shackelford Rd
- 1920 High Sun Dr
- 1830 New Sun Ct
- 2048 New Sun Dr
- 2216 Foggy Bottom Dr
- 2007 Hungerford Dr
- 2037 Hungerford Dr
- 2057 Hungerford Dr
- 1985 Hungerford Dr
- 2008 Hungerford Dr
- 2067 Hungerford Dr
- 2018 Hungerford Dr
- 1986 Hungerford Dr
- 1975 Hungerford Dr
- 2732 Freemantle Dr
- 2728 Freemantle Dr
- 2038 Hungerford Dr
- 2736 Freemantle Dr
- 1976 Hungerford Dr
- 2048 Hungerford Dr
- 2058 Hungerford Dr
- 1965 Hungerford Dr
- 2068 Hungerford Dr
- 2012 Freemantle Ct
- 2740 Freemantle Dr