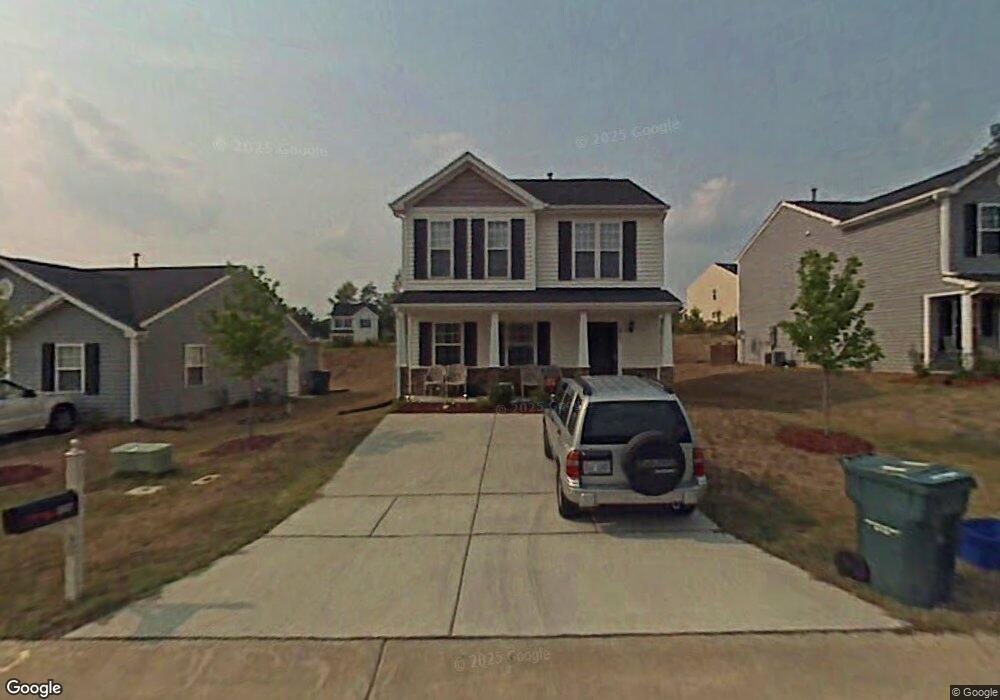
2017 Lime St Durham, NC 27704
Northeast Durham NeighborhoodEstimated Value: $287,000 - $310,000
3
Beds
3
Baths
1,368
Sq Ft
$221/Sq Ft
Est. Value
About This Home
This home is located at 2017 Lime St, Durham, NC 27704 and is currently estimated at $302,338, approximately $221 per square foot. 2017 Lime St is a home located in Durham County with nearby schools including Merrick-Moore Elementary School, John W Neal Middle School, and Southern School of Energy & Sustainability.
Ownership History
Date
Name
Owned For
Owner Type
Purchase Details
Closed on
Sep 15, 2024
Sold by
Watley Abigale Abigail O
Bought by
Abigail Watley Living Trust and Watley
Current Estimated Value
Purchase Details
Closed on
Mar 13, 2019
Sold by
Ajx Mortgage Trust Ii
Bought by
Watley Agigale O and Watley Kenneth W
Home Financials for this Owner
Home Financials are based on the most recent Mortgage that was taken out on this home.
Original Mortgage
$123,750
Interest Rate
4.4%
Mortgage Type
New Conventional
Purchase Details
Closed on
Sep 20, 2018
Sold by
Johnson Robin D
Bought by
Wilmington Savings Fund Society Fsb and Ajx Mortgage Trust Ii
Purchase Details
Closed on
Feb 3, 2017
Sold by
Johnson Robin D
Bought by
Landon Farms Homeowners Associ
Purchase Details
Closed on
Feb 15, 2006
Sold by
Anderson Homes Inc
Bought by
Johnson Robin D
Home Financials for this Owner
Home Financials are based on the most recent Mortgage that was taken out on this home.
Original Mortgage
$109,000
Interest Rate
6.14%
Mortgage Type
Fannie Mae Freddie Mac
Create a Home Valuation Report for This Property
The Home Valuation Report is an in-depth analysis detailing your home's value as well as a comparison with similar homes in the area
Home Values in the Area
Average Home Value in this Area
Purchase History
| Date | Buyer | Sale Price | Title Company |
|---|---|---|---|
| Abigail Watley Living Trust | -- | None Listed On Document | |
| Watley Agigale O | $165,000 | None Available | |
| Wilmington Savings Fund Society Fsb | $119,900 | None Available | |
| Landon Farms Homeowners Associ | $2,000 | -- | |
| Johnson Robin D | $129,000 | None Available |
Source: Public Records
Mortgage History
| Date | Status | Borrower | Loan Amount |
|---|---|---|---|
| Previous Owner | Watley Agigale O | $123,750 | |
| Previous Owner | Johnson Robin D | $109,000 |
Source: Public Records
Tax History
| Year | Tax Paid | Tax Assessment Tax Assessment Total Assessment is a certain percentage of the fair market value that is determined by local assessors to be the total taxable value of land and additions on the property. | Land | Improvement |
|---|---|---|---|---|
| 2025 | $2,897 | $292,221 | $70,000 | $222,221 |
| 2024 | $1,889 | $135,406 | $22,380 | $113,026 |
| 2023 | $1,774 | $135,406 | $22,380 | $113,026 |
| 2022 | $1,733 | $135,406 | $22,380 | $113,026 |
| 2021 | $1,725 | $135,406 | $22,380 | $113,026 |
| 2020 | $1,684 | $135,406 | $22,380 | $113,026 |
| 2019 | $1,684 | $135,406 | $22,380 | $113,026 |
| 2018 | $1,604 | $118,267 | $25,177 | $93,090 |
| 2017 | $1,592 | $118,267 | $25,177 | $93,090 |
| 2016 | $1,539 | $118,267 | $25,177 | $93,090 |
| 2015 | $1,729 | $124,913 | $23,000 | $101,913 |
| 2014 | $1,729 | $124,913 | $23,000 | $101,913 |
Source: Public Records
Map
Nearby Homes
- 1615 Great Bend Dr
- 2027 Buffalo Way
- 2028 Buffalo Way
- 2300 Crestwood Ridge Dr
- 2238 Crestwood Ridge Dr
- 18 Syracuse Place
- 2206 E Club Blvd
- 2040 Feather Rock Dr
- 1832 E Geer St
- 1515 Milan St
- 2632 Melrose Ave
- 1823 E Geer St
- 2112 Crestwood Ridge Dr
- 1811 E Geer St
- 2406 Winburn Ave
- 910 Junction Rd
- 3019 Chrys St
- 3017 Chrys St
- 1401 Milan St
- 3010 Chrys St
Your Personal Tour Guide
Ask me questions while you tour the home.