
Seller's Agent in 2025
Terri Jackson
Century 21 Homes & Investments
(478) 954-2045
128 Total Sales
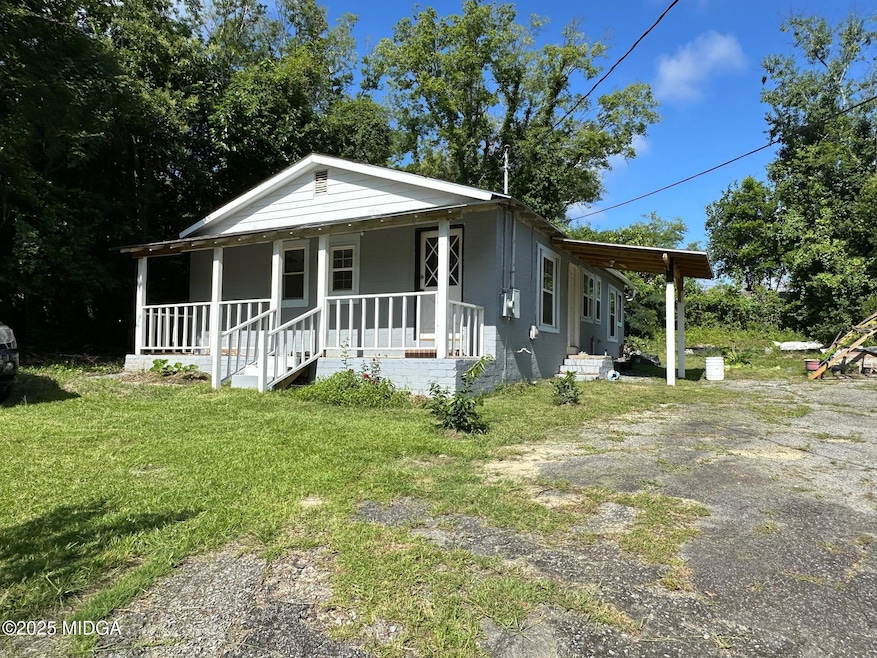
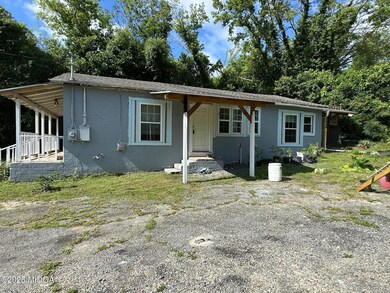
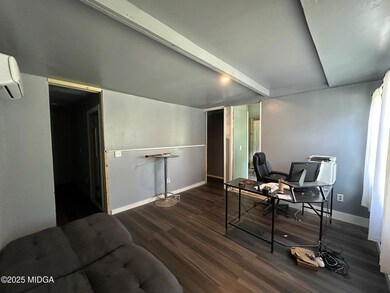
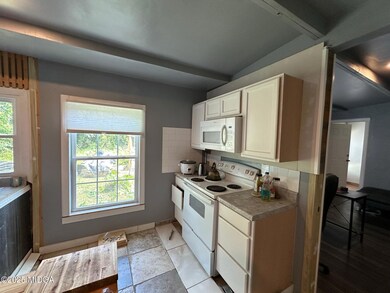
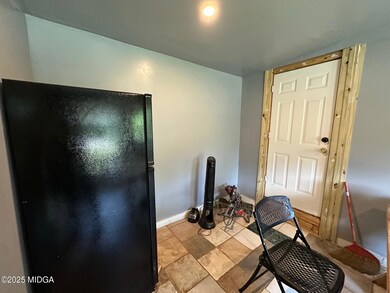
Great investment property, Home has already been updated with new 2 pane windows and air conditioning. Gardens are in bloom and there is even a chicken coop. Nice private lot located minutes from I-75 or I-475. Taxes approx. $975 per year
Last Agent to Sell the Property
Century 21 Homes & Investments License #281903 Listed on: 06/20/2025
Last Buyer's Agent
Brokered Agent
Brokered Sale
| Date | Type | Sale Price | Title Company |
|---|---|---|---|
| Warranty Deed | $47,000 | None Listed On Document | |
| Warranty Deed | $4,000 | None Available | |
| Warranty Deed | $1,250 | None Available | |
| Quit Claim Deed | -- | None Available | |
| Quit Claim Deed | -- | None Available | |
| Limited Warranty Deed | $1,925 | None Available | |
| Receivers Deed | -- | None Available | |
| Deed | $2,500 | -- | |
| Deed | $25,000 | -- | |
| Bargain Sale Deed | -- | -- | |
| Deed | $48,200 | -- |
| Date | Event | Price | List to Sale | Price per Sq Ft |
|---|---|---|---|---|
| 08/15/2025 08/15/25 | Sold | $47,000 | -27.7% | $46 / Sq Ft |
| 07/31/2025 07/31/25 | Pending | -- | -- | -- |
| 07/07/2025 07/07/25 | Price Changed | $65,000 | -7.1% | $63 / Sq Ft |
| 06/20/2025 06/20/25 | For Sale | $70,000 | -- | $68 / Sq Ft |
| Year | Tax Paid | Tax Assessment Tax Assessment Total Assessment is a certain percentage of the fair market value that is determined by local assessors to be the total taxable value of land and additions on the property. | Land | Improvement |
|---|---|---|---|---|
| 2025 | $384 | $15,637 | $2,320 | $13,317 |
| 2024 | $392 | $15,415 | $2,320 | $13,095 |
| 2023 | $376 | $12,698 | $1,600 | $11,098 |
| 2022 | $253 | $7,312 | $1,124 | $6,188 |
| 2021 | $96 | $2,527 | $1,124 | $1,403 |
| 2020 | $62 | $2,527 | $1,124 | $1,403 |
| 2019 | $99 | $2,527 | $1,124 | $1,403 |
| 2018 | $328 | $2,470 | $1,124 | $1,346 |
| 2017 | $93 | $2,470 | $1,124 | $1,346 |
| 2016 | $85 | $2,470 | $1,124 | $1,346 |
| 2015 | $121 | $2,470 | $1,124 | $1,346 |
| 2014 | -- | $4,754 | $3,259 | $1,495 |
Seller's Agent in 2025
Terri Jackson
Century 21 Homes & Investments
(478) 954-2045
128 Total Sales
B
Buyer's Agent in 2025
Brokered Agent
Brokered Sale
Source: Middle Georgia MLS
MLS Number: 180152
APN: O084-0619
Disclaimer: Certain information contained herein is derived from information provided by parties other than Homes.com. All information provided is deemed reliable, but is not guaranteed to be accurate and should be independently verified.
![]() Listings on this website come from the MGMLS IDX Compilation and may be held by
Listings on this website come from the MGMLS IDX Compilation and may be held by
brokerage firms other than the owner of this website. The listing brokerage is identified in any listing details. Information is deemed reliable but is not guaranteed. If you believe any MGMLS Listing contains material that infringes your copyrighted work, please click here to review our DMCA policy and learn how to submit a takedown
request. ©2026 MGMLS.
Ask me questions while you tour the home.