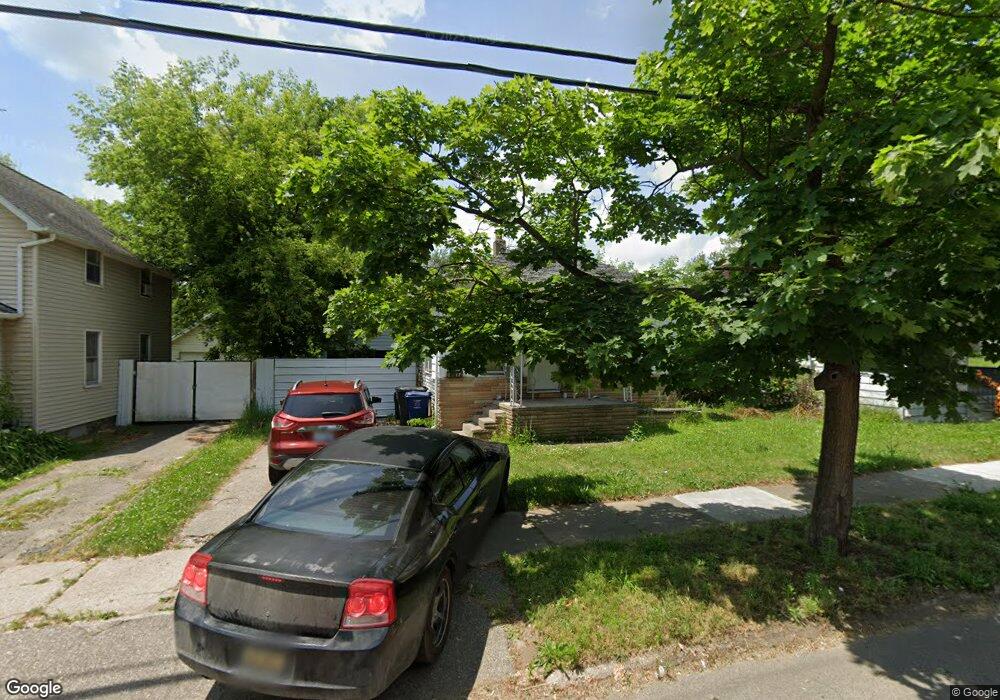
2017 Maplewood Ave Flint, MI 48506
Eastside NeighborhoodEstimated Value: $27,000 - $47,000
3
Beds
1
Bath
858
Sq Ft
$44/Sq Ft
Est. Value
About This Home
This home is located at 2017 Maplewood Ave, Flint, MI 48506 and is currently estimated at $37,905, approximately $44 per square foot. 2017 Maplewood Ave is a home located in Genesee County with nearby schools including Potter School, Flint Cultural Center Academy, and WAY Academy of Flint.
Ownership History
Date
Name
Owned For
Owner Type
Purchase Details
Closed on
Mar 7, 2016
Sold by
Dmp Holdings Llc
Bought by
Molina Abdul A
Current Estimated Value
Purchase Details
Closed on
Jan 22, 2016
Sold by
Harbour Portfolio Viii Lp
Bought by
Dmp Holdings Llc
Purchase Details
Closed on
Oct 2, 2013
Sold by
Fannie Mae
Bought by
Harbour Portfolio Viii Lp
Purchase Details
Closed on
Sep 13, 2012
Sold by
Nationstar Mortgage Llc
Bought by
Fannie Mae and Federal National Mortgage Association
Purchase Details
Closed on
Sep 5, 2012
Sold by
Schultz Kevin and Schultz Bobbie
Bought by
Nationstar Mortgage Llc
Purchase Details
Closed on
Feb 16, 2007
Sold by
Schultz Kevin and Schultz Bobbie
Bought by
B & K Family Properties Llc
Purchase Details
Closed on
Oct 26, 2006
Sold by
Estate Of Doris Thayer
Bought by
Schultz Kevin and Schultz Bobbie
Create a Home Valuation Report for This Property
The Home Valuation Report is an in-depth analysis detailing your home's value as well as a comparison with similar homes in the area
Home Values in the Area
Average Home Value in this Area
Purchase History
| Date | Buyer | Sale Price | Title Company |
|---|---|---|---|
| Molina Abdul A | -- | Attorney | |
| Dmp Holdings Llc | -- | None Available | |
| Harbour Portfolio Viii Lp | $6,096 | Servicelink | |
| Fannie Mae | -- | None Available | |
| Nationstar Mortgage Llc | $21,278 | None Available | |
| B & K Family Properties Llc | -- | None Available | |
| Schultz Kevin | $19,075 | Sargents Title Company |
Source: Public Records
Tax History
| Year | Tax Paid | Tax Assessment Tax Assessment Total Assessment is a certain percentage of the fair market value that is determined by local assessors to be the total taxable value of land and additions on the property. | Land | Improvement |
|---|---|---|---|---|
| 2025 | $712 | $11,600 | $0 | $0 |
| 2024 | $669 | $10,900 | $0 | $0 |
| 2023 | $662 | $9,500 | $0 | $0 |
| 2022 | $0 | $7,700 | $0 | $0 |
| 2021 | $666 | $7,300 | $0 | $0 |
| 2020 | $623 | $6,500 | $0 | $0 |
| 2019 | $617 | $6,600 | $0 | $0 |
| 2018 | $584 | $5,200 | $0 | $0 |
| 2017 | $600 | $0 | $0 | $0 |
| 2016 | $614 | $0 | $0 | $0 |
| 2015 | -- | $0 | $0 | $0 |
| 2014 | -- | $0 | $0 | $0 |
| 2012 | -- | $7,700 | $0 | $0 |
Source: Public Records
Map
Nearby Homes
- 1805 Bennett Ave
- 1622 Arlington Ave
- 2506 Arlington Ave
- 2426 Broadway Blvd
- 1721 New York Ave
- 1529 Broadway Blvd
- 1501 Arlington Ave
- 2321 Levern St
- 1724 Ohio Ave
- 1629 New York Ave
- 1540 Illinois Ave
- 1318 Cronk Ave
- 1609 Ohio Ave
- 1513 Jane Ave
- 2211 Torrance St
- 2217 Maryland Ave
- 2426 Hoff St
- 2601 Illinois Ave
- 2301 Missouri Ave
- 2415 Pennsylvania Ave
- 2013 Maplewood Ave
- 2021 Maplewood Ave
- 2016 N Franklin Ave
- 2105 Maplewood Ave
- 2018 Maplewood Ave
- 2010 Maplewood Ave
- 2020 N Franklin Ave
- 2102 Maplewood Ave
- 2107 Maplewood Ave
- 2106 Maplewood Ave
- 2113 Maplewood Ave
- 2015 N Franklin Ave
- 2017 Arlington Ave
- 2110 Maplewood Ave
- 2021 Arlington Ave
- 2101 Arlington Ave
- 2108 N Franklin Ave
- 1922 Maplewood Ave
- 1821 Broadway Blvd
- 1822 E Hamilton Ave
Your Personal Tour Guide
Ask me questions while you tour the home.