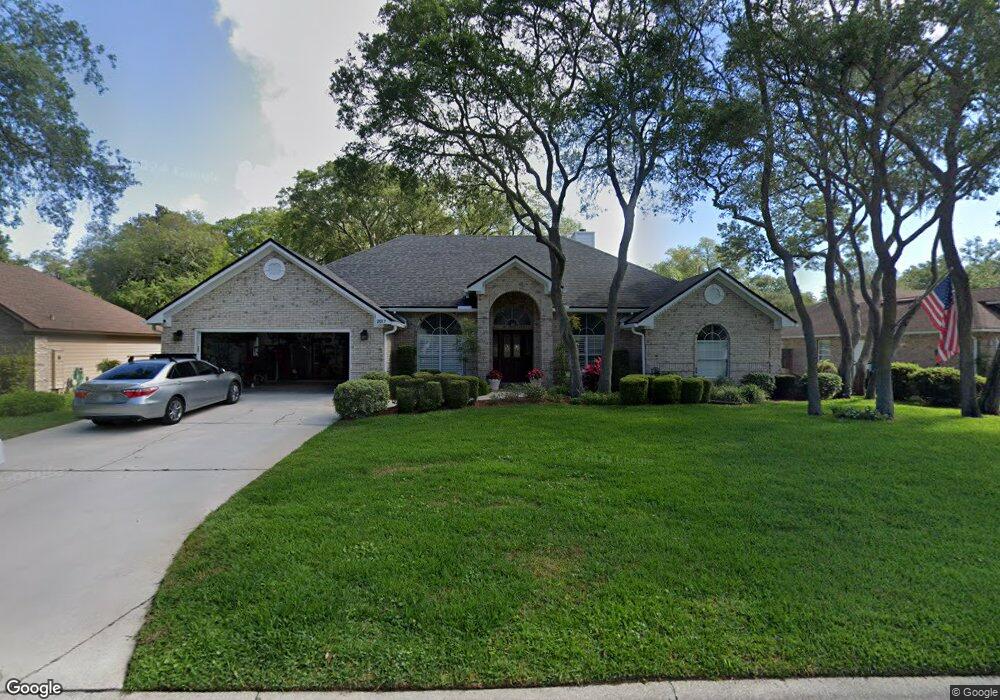
2017 Marye Brant Loop N Neptune Beach, FL 32266
Estimated Value: $710,214 - $905,000
3
Beds
2
Baths
2,134
Sq Ft
$373/Sq Ft
Est. Value
About This Home
This home is located at 2017 Marye Brant Loop N, Neptune Beach, FL 32266 and is currently estimated at $795,054, approximately $372 per square foot. 2017 Marye Brant Loop N is a home located in Duval County with nearby schools including Neptune Beach Elementary School, Duncan U. Fletcher Middle School, and Duncan U. Fletcher High School.
Ownership History
Date
Name
Owned For
Owner Type
Purchase Details
Closed on
Sep 15, 2000
Sold by
Ross Paul S
Bought by
Barbarito Edward and Barbarito Lisa
Current Estimated Value
Home Financials for this Owner
Home Financials are based on the most recent Mortgage that was taken out on this home.
Original Mortgage
$135,000
Outstanding Balance
$47,016
Interest Rate
8.05%
Estimated Equity
$748,038
Purchase Details
Closed on
Apr 27, 1998
Sold by
Ross Joanne J
Bought by
Ross Paul S
Create a Home Valuation Report for This Property
The Home Valuation Report is an in-depth analysis detailing your home's value as well as a comparison with similar homes in the area
Home Values in the Area
Average Home Value in this Area
Purchase History
| Date | Buyer | Sale Price | Title Company |
|---|---|---|---|
| Barbarito Edward | $207,500 | -- | |
| Ross Paul S | $100 | -- |
Source: Public Records
Mortgage History
| Date | Status | Borrower | Loan Amount |
|---|---|---|---|
| Open | Barbarito Edward | $135,000 |
Source: Public Records
Tax History
| Year | Tax Paid | Tax Assessment Tax Assessment Total Assessment is a certain percentage of the fair market value that is determined by local assessors to be the total taxable value of land and additions on the property. | Land | Improvement |
|---|---|---|---|---|
| 2026 | $3,658 | $246,911 | -- | -- |
| 2025 | $3,566 | $246,911 | -- | -- |
| 2024 | $3,460 | $239,953 | -- | -- |
| 2023 | $3,460 | $232,965 | $0 | $0 |
| 2022 | $3,151 | $226,180 | $0 | $0 |
| 2021 | $3,126 | $219,593 | $0 | $0 |
| 2020 | $3,093 | $216,562 | $0 | $0 |
| 2019 | $3,055 | $211,694 | $0 | $0 |
| 2018 | $3,012 | $207,747 | $0 | $0 |
| 2017 | $2,972 | $203,475 | $0 | $0 |
| 2016 | $2,953 | $199,290 | $0 | $0 |
| 2015 | $2,983 | $197,905 | $0 | $0 |
| 2014 | $2,988 | $196,335 | $0 | $0 |
Source: Public Records
Map
Nearby Homes
- 2009 Marye Brant Loop N
- 0 Marsh Point Rd
- 320 Sunrise Cir
- 1074 Kings Rd
- 1828 Hamlet Ln N
- 1505 Spindrift Cir W
- 156 Sandy Beach Ln
- 961 Calypso Way Unit LOT 20
- 113 Oceangate Dr
- 101 Oceangate Dr
- 1114 Scheidel Ct Unit 6
- 1110 Scheidel Ct
- 1419 Forest Marsh Dr
- 836 Cavalla Rd
- 43 Saratoga Cir N
- 509 Penman Rd
- 1124 Oceanwood Dr S
- 714 Aquatic Dr
- 0 Hickory Marsh Ln Unit 256630
- 365 Sargo Rd
- 2013 Marye Brant Loop N
- 2010 Acacia Rd
- 2018 Acacia Rd
- 2026 Acacia Rd
- 2025 Marye Brant Loop N
- 2009 Oleander Place
- 2016 Marye Brant Loop N
- 2002 Acacia Rd
- 2020 Marye Brant Loop N
- 2012 Marye Brant Loop N
- 2010 Rosewood Dr
- 2017 Oleander Place
- 2008 Marye Brant Loop N
- 2005 Marye Brant Loop N
- 2024 Marye Brant Loop N
- 2018 Rosewood Dr
- 2029 Marye Brant Loop N
- 2025 Oleander Place
- 2058 Rosewood Dr
- 2015 Marye Brant Loop S
Your Personal Tour Guide
Ask me questions while you tour the home.