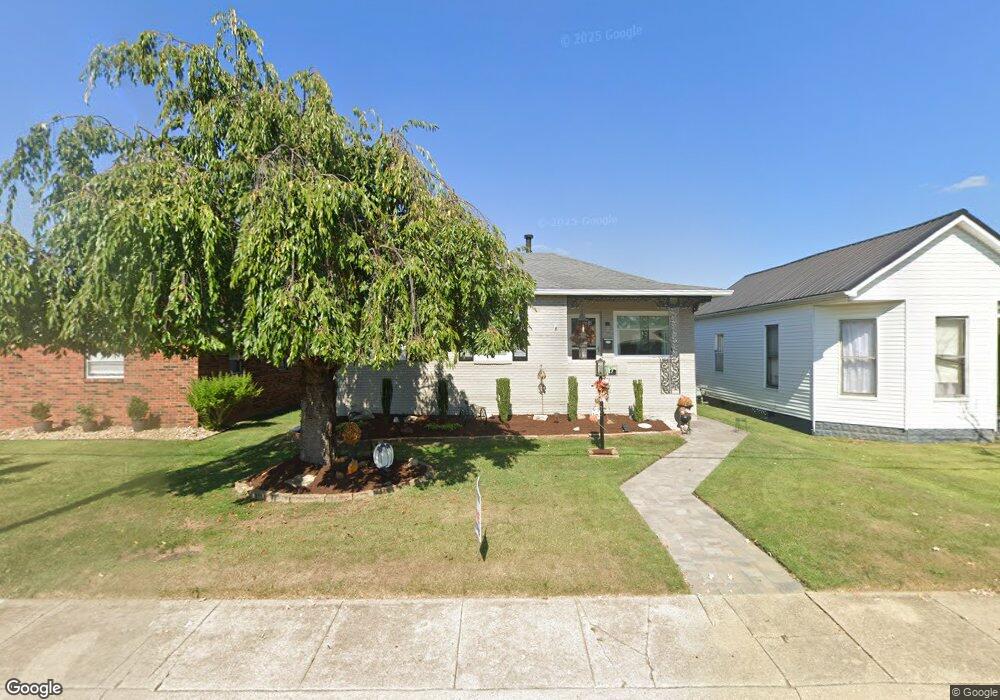
2017 N 2nd St Ironton, OH 45638
Estimated Value: $139,000 - $186,000
3
Beds
2
Baths
1,344
Sq Ft
$113/Sq Ft
Est. Value
About This Home
This home is located at 2017 N 2nd St, Ironton, OH 45638 and is currently estimated at $152,258, approximately $113 per square foot. 2017 N 2nd St is a home located in Lawrence County with nearby schools including Ironton Elementary School, Ironton Middle School, and Ironton High School.
Ownership History
Date
Name
Owned For
Owner Type
Purchase Details
Closed on
Aug 22, 2022
Sold by
Laber Christopher M and Laber Jane A
Bought by
Laber Jane A and Laber Jerrod A
Current Estimated Value
Purchase Details
Closed on
Jun 27, 1996
Sold by
Kincaid Georgene C Life
Bought by
Kaincaid Georgene C Life and Laber J
Purchase Details
Closed on
Nov 22, 1994
Sold by
Kinkaid Georgene C
Bought by
Kincaid Georgene C Life
Create a Home Valuation Report for This Property
The Home Valuation Report is an in-depth analysis detailing your home's value as well as a comparison with similar homes in the area
Home Values in the Area
Average Home Value in this Area
Purchase History
| Date | Buyer | Sale Price | Title Company |
|---|---|---|---|
| Laber Jane A | -- | Waldo Jenna J | |
| Laber Jane A | -- | Waldo Jenna J | |
| Kaincaid Georgene C Life | -- | -- | |
| Kincaid Georgene C Life | -- | -- |
Source: Public Records
Tax History Compared to Growth
Tax History
| Year | Tax Paid | Tax Assessment Tax Assessment Total Assessment is a certain percentage of the fair market value that is determined by local assessors to be the total taxable value of land and additions on the property. | Land | Improvement |
|---|---|---|---|---|
| 2024 | -- | $30,190 | $5,120 | $25,070 |
| 2023 | $1,091 | $30,190 | $5,120 | $25,070 |
| 2022 | $1,089 | $30,190 | $5,120 | $25,070 |
| 2021 | $1,018 | $27,090 | $4,240 | $22,850 |
| 2020 | $1,034 | $27,090 | $4,240 | $22,850 |
| 2019 | $1,030 | $27,090 | $4,240 | $22,850 |
| 2018 | $1,041 | $27,090 | $4,240 | $22,850 |
| 2017 | $1,039 | $27,090 | $4,240 | $22,850 |
| 2016 | $974 | $27,090 | $4,240 | $22,850 |
| 2015 | $1,093 | $29,360 | $4,670 | $24,690 |
| 2014 | $1,054 | $29,360 | $4,670 | $24,690 |
| 2013 | $1,052 | $29,360 | $4,670 | $24,690 |
Source: Public Records
Map
Nearby Homes