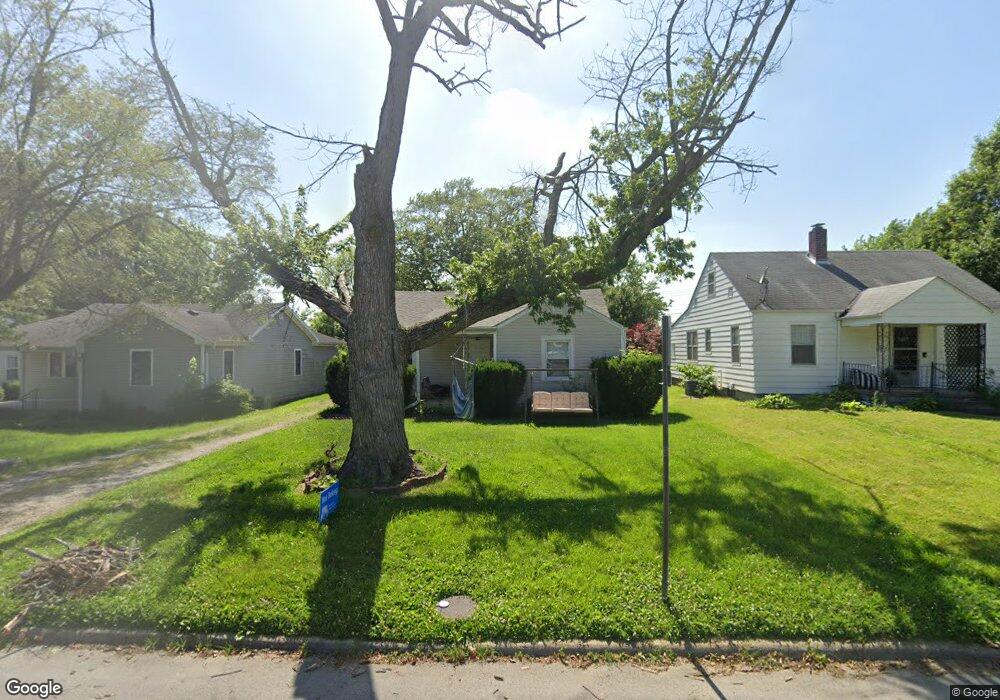
2017 N Maplewood Ave Muncie, IN 47304
Anthony-Northside NeighborhoodEstimated Value: $129,000 - $141,095
4
Beds
2
Baths
1,272
Sq Ft
$107/Sq Ft
Est. Value
About This Home
This home is located at 2017 N Maplewood Ave, Muncie, IN 47304 and is currently estimated at $136,274, approximately $107 per square foot. 2017 N Maplewood Ave is a home located in Delaware County with nearby schools including Muncie Central High School, West View Elementary School, and Northside Middle School.
Ownership History
Date
Name
Owned For
Owner Type
Purchase Details
Closed on
Oct 17, 2025
Sold by
Nck Holdings Llc
Bought by
Whim & Proper Llc
Current Estimated Value
Home Financials for this Owner
Home Financials are based on the most recent Mortgage that was taken out on this home.
Original Mortgage
$123,750
Outstanding Balance
$123,750
Interest Rate
6.26%
Mortgage Type
New Conventional
Estimated Equity
$12,524
Purchase Details
Closed on
Mar 30, 2022
Sold by
King Nicholas D and King Catherine
Bought by
Nck Holdings Llc
Purchase Details
Closed on
Mar 30, 2017
Sold by
B & T Rentals Llc
Bought by
King Nicholas D and King Catherine
Home Financials for this Owner
Home Financials are based on the most recent Mortgage that was taken out on this home.
Original Mortgage
$125,600
Interest Rate
4.15%
Mortgage Type
New Conventional
Purchase Details
Closed on
Aug 25, 2009
Sold by
Peterson Brian D and Peterson Tracy L
Bought by
B & T Rentals Llc
Purchase Details
Closed on
Sep 13, 2006
Sold by
B & T Rentals Llc
Bought by
Peterson Brian D and Peterson Tracy L
Home Financials for this Owner
Home Financials are based on the most recent Mortgage that was taken out on this home.
Original Mortgage
$72,800
Interest Rate
6.7%
Mortgage Type
New Conventional
Create a Home Valuation Report for This Property
The Home Valuation Report is an in-depth analysis detailing your home's value as well as a comparison with similar homes in the area
Home Values in the Area
Average Home Value in this Area
Purchase History
| Date | Buyer | Sale Price | Title Company |
|---|---|---|---|
| Whim & Proper Llc | -- | None Listed On Document | |
| Nck Holdings Llc | -- | Wesley James R | |
| King Nicholas D | -- | -- | |
| B & T Rentals Llc | -- | None Available | |
| Peterson Brian D | -- | None Available |
Source: Public Records
Mortgage History
| Date | Status | Borrower | Loan Amount |
|---|---|---|---|
| Open | Whim & Proper Llc | $123,750 | |
| Previous Owner | King Nicholas D | $125,600 | |
| Previous Owner | Peterson Brian D | $72,800 |
Source: Public Records
Tax History Compared to Growth
Tax History
| Year | Tax Paid | Tax Assessment Tax Assessment Total Assessment is a certain percentage of the fair market value that is determined by local assessors to be the total taxable value of land and additions on the property. | Land | Improvement |
|---|---|---|---|---|
| 2024 | $2,482 | $118,200 | $12,600 | $105,600 |
| 2023 | $2,164 | $102,300 | $10,500 | $91,800 |
| 2022 | $1,942 | $91,200 | $10,500 | $80,700 |
| 2021 | $1,812 | $84,700 | $9,500 | $75,200 |
| 2020 | $1,586 | $73,400 | $9,500 | $63,900 |
| 2019 | $1,484 | $68,300 | $8,600 | $59,700 |
| 2018 | $1,472 | $67,700 | $8,600 | $59,100 |
| 2017 | $1,328 | $60,500 | $7,500 | $53,000 |
| 2016 | $1,296 | $58,900 | $7,500 | $51,400 |
| 2014 | $1,181 | $56,400 | $7,900 | $48,500 |
| 2013 | -- | $55,800 | $7,900 | $47,900 |
Source: Public Records
Map
Nearby Homes
- 2117 N Maplewood Ave
- 2309 N Maplewood Ave
- 2212 N Ball Ave
- 1716 N Ball Ave
- 2300 N Ball Ave
- 2304 N Ball Ave
- 2009 W Sherman Dr
- 1623 N Janney Ave
- 2701 N Oakwood Ave
- 1625 N New York Ave
- 2201 W Euclid Ave
- 1108 W Weber Dr
- 2208 W Parkway Dr
- 2701 N Richmond Dr
- 1119 W Bethel Ave
- 2011 W Mcgalliard Rd
- 1000 W Waid Ave
- 2001 W Woodmont Dr
- 2809 W Beckett Dr
- 1224 W Carson St
- 2021 N Maplewood Ave
- 2013 N Maplewood Ave
- 2009 N Maplewood Ave
- 2101 N Maplewood Ave
- 2005 N Maplewood Ave
- 2020 N Hollywood Ave
- 2024 N Hollywood Ave
- 2012 N Hollywood Ave
- 2016 N Maplewood Ave
- 2001 N Maplewood Ave
- 2012 N Maplewood Ave
- 2020 N Maplewood Ave
- 2105 N Maplewood Ave
- 2100 N Hollywood Ave
- 2008 N Maplewood Ave
- 2004 N Maplewood Ave
- 2100 N Maplewood Ave
- 2104 N Hollywood Ave
- 2000 N Hollywood Ave
- 2000 N Maplewood Ave