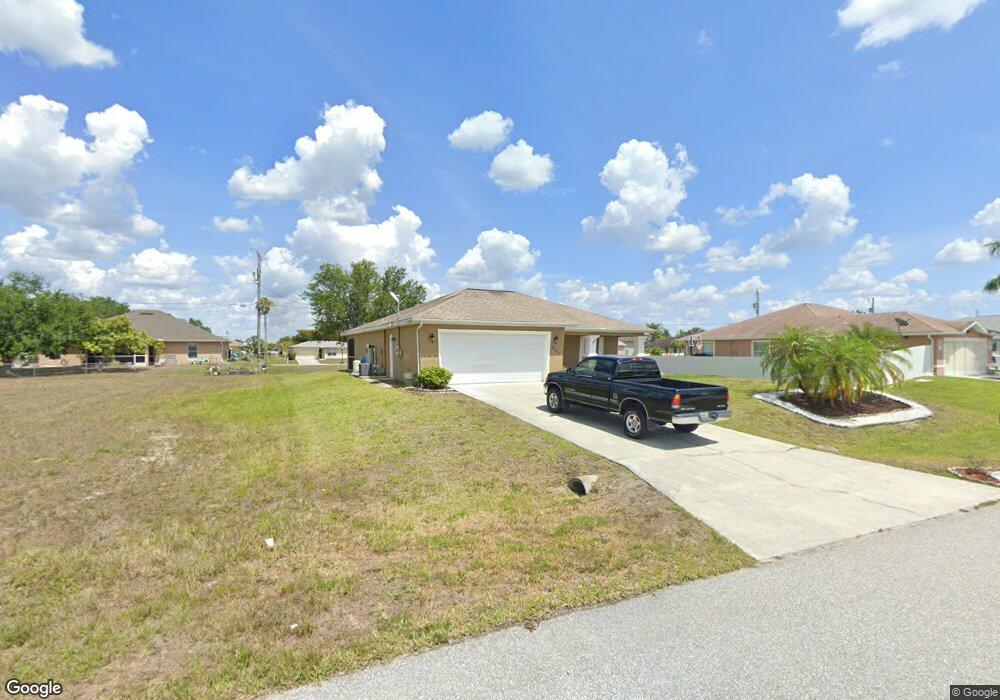
2017 NE 6th Place Cape Coral, FL 33909
Diplomat NeighborhoodEstimated Value: $264,407 - $309,000
3
Beds
2
Baths
1,418
Sq Ft
$205/Sq Ft
Est. Value
About This Home
This home is located at 2017 NE 6th Place, Cape Coral, FL 33909 and is currently estimated at $290,602, approximately $204 per square foot. 2017 NE 6th Place is a home located in Lee County with nearby schools including Dr. Carrie D. Robinson Littleton Elementary School, Caloosa Elementary School, and Tropic Isles Elementary School.
Ownership History
Date
Name
Owned For
Owner Type
Purchase Details
Closed on
Oct 18, 2018
Sold by
House Kevin and House Tammy
Bought by
Hammer Dawn Marie and Jordan Kim Marie
Current Estimated Value
Purchase Details
Closed on
Dec 8, 2016
Sold by
Librera Joseph and Librera Dolores
Bought by
Hammer Dawn Marie and Jordan Kim Marie
Purchase Details
Closed on
Sep 23, 2009
Sold by
Alliance Capital Inc
Bought by
Librera Joseph and Librera Dolores
Purchase Details
Closed on
Aug 11, 2009
Sold by
Grau Nancy J
Bought by
Alliance Capital Inc
Purchase Details
Closed on
Nov 21, 2005
Sold by
K Hovnanian First Homes Llc
Bought by
Grau Nancy J and Perez Tania
Home Financials for this Owner
Home Financials are based on the most recent Mortgage that was taken out on this home.
Original Mortgage
$188,636
Interest Rate
8.8%
Mortgage Type
Unknown
Purchase Details
Closed on
Feb 19, 2004
Sold by
Fernandez Julio
Bought by
First Home Builders Of Florida
Create a Home Valuation Report for This Property
The Home Valuation Report is an in-depth analysis detailing your home's value as well as a comparison with similar homes in the area
Home Values in the Area
Average Home Value in this Area
Purchase History
| Date | Buyer | Sale Price | Title Company |
|---|---|---|---|
| Hammer Dawn Marie | $80,000 | Attorney | |
| Hammer Dawn Marie | -- | None Available | |
| Librera Joseph | $83,000 | South Florida Trust & Title | |
| Alliance Capital Inc | $64,100 | None Available | |
| Grau Nancy J | $235,800 | First Home Title | |
| First Home Builders Of Florida | $26,000 | First Home Title |
Source: Public Records
Mortgage History
| Date | Status | Borrower | Loan Amount |
|---|---|---|---|
| Previous Owner | Grau Nancy J | $188,636 |
Source: Public Records
Tax History Compared to Growth
Tax History
| Year | Tax Paid | Tax Assessment Tax Assessment Total Assessment is a certain percentage of the fair market value that is determined by local assessors to be the total taxable value of land and additions on the property. | Land | Improvement |
|---|---|---|---|---|
| 2025 | $4,208 | $216,645 | -- | -- |
| 2024 | $3,988 | $196,950 | -- | -- |
| 2023 | $3,988 | $179,045 | $0 | $0 |
| 2022 | $3,532 | $162,768 | $0 | $0 |
| 2021 | $3,139 | $147,971 | $8,400 | $139,571 |
| 2020 | $3,044 | $138,091 | $7,500 | $130,591 |
| 2019 | $2,947 | $134,047 | $10,500 | $123,547 |
| 2018 | $2,870 | $134,854 | $10,500 | $124,354 |
| 2017 | $2,745 | $130,011 | $9,500 | $120,511 |
| 2016 | $2,504 | $113,884 | $9,500 | $104,384 |
| 2015 | $2,310 | $99,699 | $6,900 | $92,799 |
| 2014 | -- | $95,511 | $5,170 | $90,341 |
| 2013 | -- | $82,303 | $4,200 | $78,103 |
Source: Public Records
Map
Nearby Homes
- 2020 NE 6th Place
- 2104 NE 7th Ave
- 2012 NE 7th Place
- 2016 NE 6th Ave
- 2020 NE 6th Ave
- 2105 NE 6th Ave
- 2025 NE 5th Place
- 2109 NE 5th Place
- 2116 NE 5th Place
- 1203 NE 19th Terrace
- 335 NE 19th Terrace
- 506 NE 20th Terrace
- 2204 NE 7th Ave
- 2025 NE 5th Ave
- 2208 NE 6th Ave
- 426 NE 20th St
- 422 NE 20th Terrace
- 2130 NE 8th Place
- 2118 NE 5th Ave
- 2109 NE 8th Place
- 2013 NE 6th Place
- 2025 NE 6th Place
- 2012 NE 7th Ave
- 2024 NE 7th Ave
- 2012 NE 6th Place
- 2007 NE 6th Place
- 2006 NE 7th Ave
- 2024 NE 6th Place
- 2006 NE 6th Place
- 2028 NE 6th Place
- 2017 NE 7th Ave
- 2019 NE 6th Ave
- 2002 NE 7th Ave
- 2021 NE 7th Ave
- 2013 NE 6th Ave Unit 5
- 2013 NE 7th Ave
- 2101 NE 6th Place Unit 36
- 2101 NE 6th Place
- 2025 NE 6th Ave
- 2025 NE 7th Ave