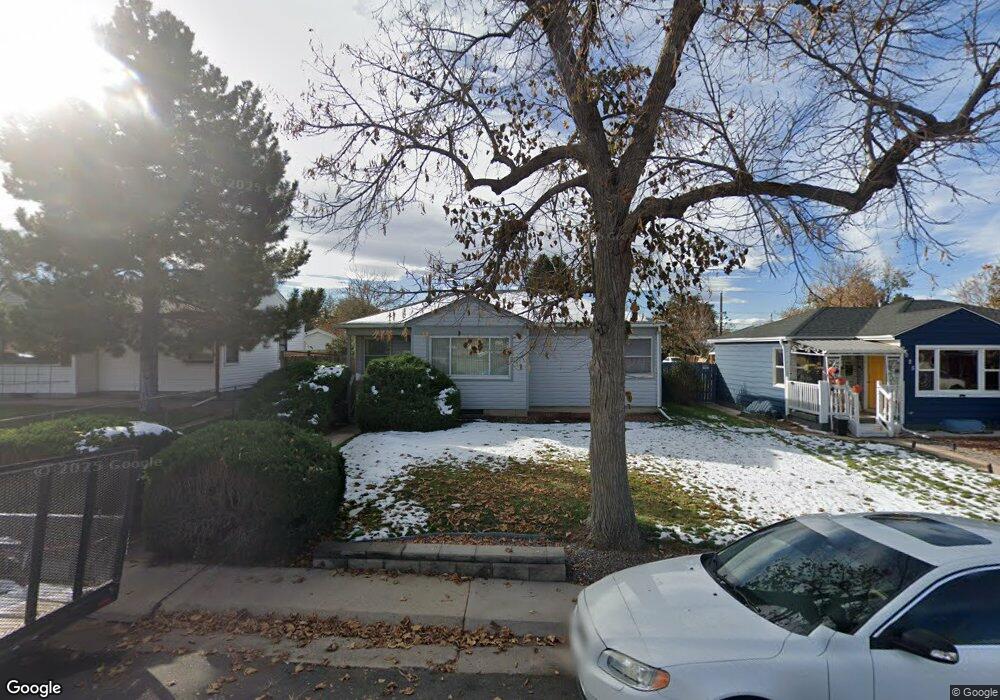
2017 Newark St Aurora, CO 80010
North Aurora NeighborhoodEstimated Value: $377,000 - $413,000
3
Beds
1
Bath
1,033
Sq Ft
$383/Sq Ft
Est. Value
About This Home
This home is located at 2017 Newark St, Aurora, CO 80010 and is currently estimated at $396,054, approximately $383 per square foot. 2017 Newark St is a home located in Adams County with nearby schools including Montview Elementary School, North Middle School Health Sciences & Technology, and Aurora Central High School.
Ownership History
Date
Name
Owned For
Owner Type
Purchase Details
Closed on
Dec 26, 2020
Sold by
Southerland Denise M and Southerland Denise M
Bought by
Southerland Denise M
Current Estimated Value
Home Financials for this Owner
Home Financials are based on the most recent Mortgage that was taken out on this home.
Original Mortgage
$213,000
Outstanding Balance
$169,633
Interest Rate
2.6%
Mortgage Type
New Conventional
Estimated Equity
$226,421
Purchase Details
Closed on
Sep 23, 2005
Sold by
Thornton Eric E and Thornton Denise M
Bought by
Thornton Denise M
Home Financials for this Owner
Home Financials are based on the most recent Mortgage that was taken out on this home.
Original Mortgage
$113,500
Interest Rate
5.73%
Mortgage Type
New Conventional
Purchase Details
Closed on
Aug 18, 1992
Create a Home Valuation Report for This Property
The Home Valuation Report is an in-depth analysis detailing your home's value as well as a comparison with similar homes in the area
Home Values in the Area
Average Home Value in this Area
Purchase History
| Date | Buyer | Sale Price | Title Company |
|---|---|---|---|
| Southerland Denise M | -- | None Available | |
| Thornton Denise M | -- | -- | |
| -- | $52,500 | -- |
Source: Public Records
Mortgage History
| Date | Status | Borrower | Loan Amount |
|---|---|---|---|
| Open | Southerland Denise M | $213,000 | |
| Closed | Thornton Denise M | $113,500 |
Source: Public Records
Tax History
| Year | Tax Paid | Tax Assessment Tax Assessment Total Assessment is a certain percentage of the fair market value that is determined by local assessors to be the total taxable value of land and additions on the property. | Land | Improvement |
|---|---|---|---|---|
| 2025 | $2,376 | $25,770 | $5,440 | $20,330 |
| 2024 | $2,376 | $23,690 | $5,000 | $18,690 |
| 2023 | $2,414 | $26,380 | $5,210 | $21,170 |
| 2022 | $2,509 | $22,080 | $5,350 | $16,730 |
| 2021 | $2,615 | $22,080 | $5,350 | $16,730 |
| 2020 | $2,643 | $22,400 | $5,510 | $16,890 |
| 2019 | $2,639 | $22,400 | $5,510 | $16,890 |
| 2018 | $1,983 | $16,760 | $4,320 | $12,440 |
| 2017 | $1,761 | $16,760 | $4,320 | $12,440 |
| 2016 | $1,155 | $10,900 | $2,470 | $8,430 |
| 2015 | $1,119 | $10,900 | $2,470 | $8,430 |
| 2014 | $915 | $8,780 | $1,830 | $6,950 |
Source: Public Records
Map
Nearby Homes
- 1945 Nome St
- 1764 Newark St
- 2209 Macon St
- 2045 Lima St
- 1781 N Oakland St
- 1764 Oswego St
- 1680 Newark St
- 1732 Lansing St
- 11087 Montview Blvd
- 2341 Oakland St
- 1671 Oswego St
- 2381 Nome St
- 1902 Kenton St
- 1605 Oakland St
- 2381 Oswego St
- 2522 Moline St
- 12056 E 25th Ave
- 1741 Joliet St
- 1745 Jamaica St
- 11336 E 27th Ave
- 2009 Newark St
- 2025 Newark St
- 2035 Newark St
- 2001 Newark St
- 2045 Newark St
- 2016 Moline St
- 2024 Moline St
- 2032 Moline St
- 2000 Moline St
- 2000 Moline St Unit ST
- 2020 Newark St
- 2055 Newark St
- 2030 Newark St
- 2040 Newark St
- 2065 Newark St
- 2048 Moline St
- 2050 Newark St
- 1992 Moline St
- 2056 Moline St
- 2069 Newark St
Your Personal Tour Guide
Ask me questions while you tour the home.