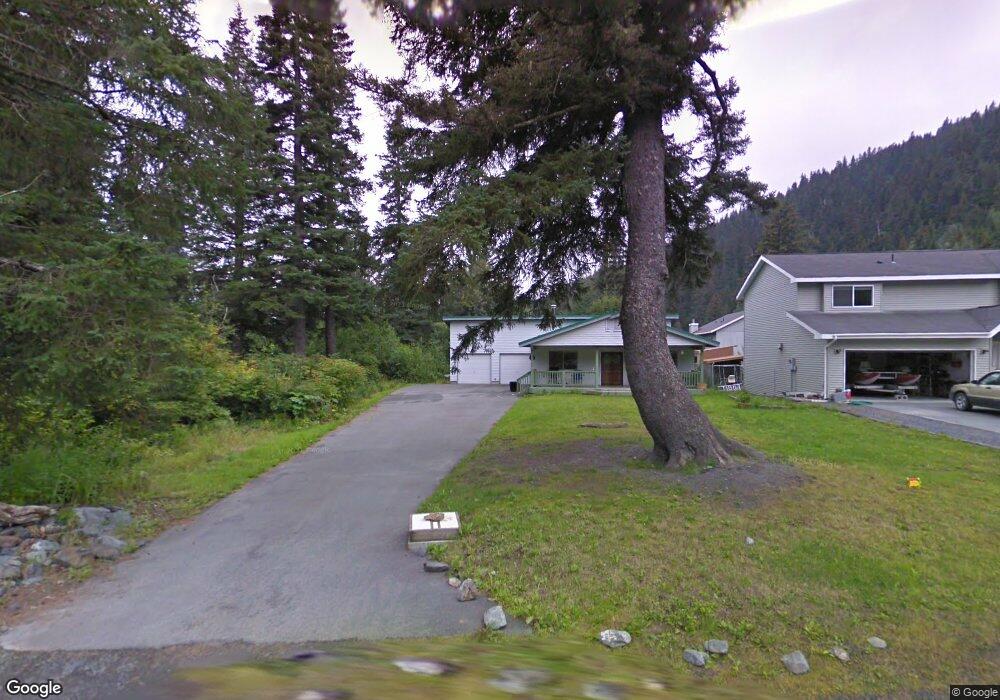
2017 Olympia Rd Seward, AK 99664
Estimated Value: $440,323 - $600,000
3
Beds
2
Baths
1,500
Sq Ft
$347/Sq Ft
Est. Value
About This Home
This home is located at 2017 Olympia Rd, Seward, AK 99664 and is currently estimated at $520,162, approximately $346 per square foot. 2017 Olympia Rd is a home located in Kenai Peninsula Borough with nearby schools including William H. Seward Elementary School and Seward High School.
Ownership History
Date
Name
Owned For
Owner Type
Purchase Details
Closed on
Mar 8, 2023
Sold by
Vansommerfeld Gary and Sommerfeld Polly Deane
Bought by
Todd Joshua F and Wong Wei Ying
Current Estimated Value
Home Financials for this Owner
Home Financials are based on the most recent Mortgage that was taken out on this home.
Original Mortgage
$369,000
Outstanding Balance
$355,709
Interest Rate
6.12%
Mortgage Type
New Conventional
Estimated Equity
$164,453
Create a Home Valuation Report for This Property
The Home Valuation Report is an in-depth analysis detailing your home's value as well as a comparison with similar homes in the area
Purchase History
| Date | Buyer | Sale Price | Title Company |
|---|---|---|---|
| Todd Joshua F | -- | None Listed On Document |
Source: Public Records
Mortgage History
| Date | Status | Borrower | Loan Amount |
|---|---|---|---|
| Open | Todd Joshua F | $369,000 |
Source: Public Records
Tax History
| Year | Tax Paid | Tax Assessment Tax Assessment Total Assessment is a certain percentage of the fair market value that is determined by local assessors to be the total taxable value of land and additions on the property. | Land | Improvement |
|---|---|---|---|---|
| 2025 | $3,093 | $375,700 | $64,800 | $310,900 |
| 2024 | $3,093 | $367,400 | $63,500 | $303,900 |
| 2023 | $697 | $331,400 | $51,700 | $279,700 |
| 2022 | $618 | $310,900 | $47,000 | $263,900 |
| 2021 | $2,433 | $292,000 | $40,300 | $251,700 |
| 2020 | $2,769 | $298,100 | $40,300 | $257,800 |
| 2019 | $1,294 | $278,600 | $37,000 | $241,600 |
| 2018 | $2,433 | $261,900 | $32,200 | $229,700 |
| 2017 | $2,062 | $246,300 | $32,200 | $214,100 |
| 2016 | $1,693 | $202,300 | $32,200 | $170,100 |
| 2015 | $1,429 | $185,400 | $32,200 | $153,200 |
| 2014 | $1,429 | $183,100 | $32,200 | $150,900 |
Source: Public Records
Map
Nearby Homes
- 2017 Dora Way
- 1620 Phoenix Rd
- 1810 Parks Place
- 1701 Phoenix Rd
- 1812 Parks Place
- 2417 Maple St
- NHN Seward Hwy
- 508 & 506 Madison St
- 425 Fourth Ave
- 505 6th Ave
- 31940 Maxwell Ct
- 31805 Maxwell Ct
- 31825 Maxwell Ct
- 0-B Seward St
- L5A-3 Maximilian Dr
- 10411 Bear Paw Dr
- 33784 Nash Rd
- 12265 Lancelot Dr
- 32195 Bear Chase Cir
- 12492 Camelot Dr
Your Personal Tour Guide
Ask me questions while you tour the home.