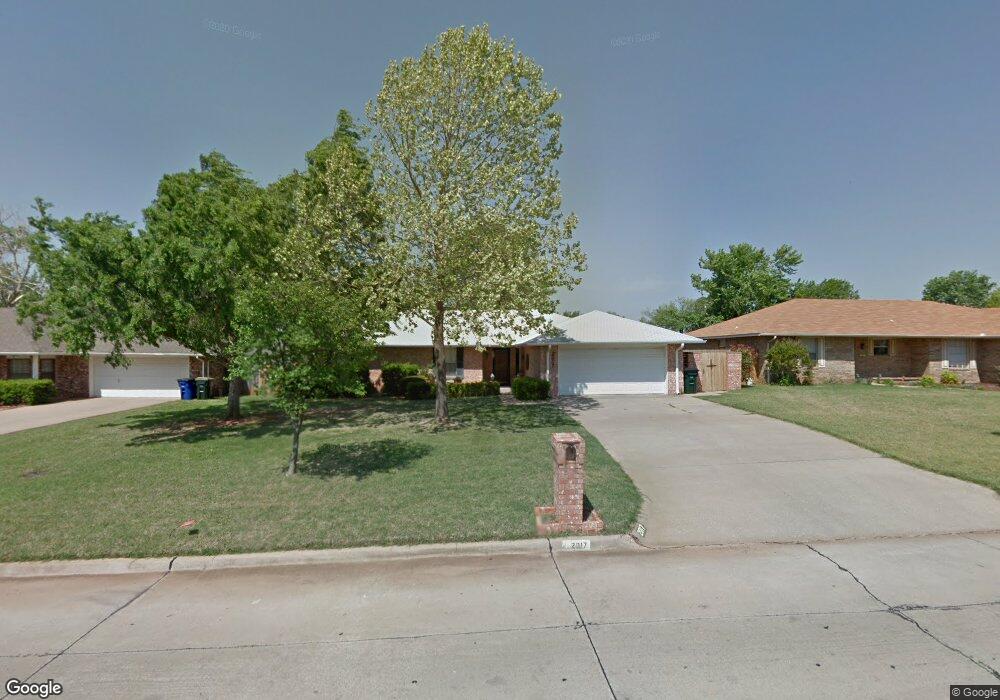
2017 Overland Dr Duncan, OK 73533
Estimated Value: $190,000 - $235,000
3
Beds
2
Baths
1,715
Sq Ft
$124/Sq Ft
Est. Value
About This Home
This home is located at 2017 Overland Dr, Duncan, OK 73533 and is currently estimated at $212,080, approximately $123 per square foot. 2017 Overland Dr is a home located in Stephens County with nearby schools including Horace Mann Elementary School, Duncan Middle School, and Duncan High School.
Ownership History
Date
Name
Owned For
Owner Type
Purchase Details
Closed on
Mar 31, 2025
Sold by
Jlc Real Estate Llc
Bought by
Newsom Nona
Current Estimated Value
Purchase Details
Closed on
Oct 11, 2024
Sold by
Fleming Gary Dale and Fleming Dawn
Bought by
Jlc Real Estate Llc
Purchase Details
Closed on
Oct 26, 2021
Sold by
Dees Nita L and Dees Darrel Wayne
Bought by
Fleming Lajuan H
Purchase Details
Closed on
Oct 21, 2021
Sold by
Fleming Lajuan H and Fleming Lajuan
Bought by
Fleming Lajuan H and Fleming Gary Dale
Purchase Details
Closed on
Apr 11, 2018
Sold by
Fleming Jerel D and Fleming Lajuan H
Bought by
Fleming Jerel D and Fleming Lajuan H
Purchase Details
Closed on
Jul 29, 1998
Sold by
Porter Betty Blackburn
Bought by
Fleming Jerel D and Fleming Lajuan H
Purchase Details
Closed on
Jun 1, 1995
Sold by
Black Evan A
Create a Home Valuation Report for This Property
The Home Valuation Report is an in-depth analysis detailing your home's value as well as a comparison with similar homes in the area
Home Values in the Area
Average Home Value in this Area
Purchase History
| Date | Buyer | Sale Price | Title Company |
|---|---|---|---|
| Newsom Nona | $226,000 | Stephens County Abstract | |
| Newsom Nona | $226,000 | Stephens County Abstract | |
| Jlc Real Estate Llc | $124,000 | Stephens County Abstract | |
| Fleming Lajuan H | -- | None Available | |
| Fleming Lajuan H | -- | None Available | |
| Fleming Jerel D | -- | None Available | |
| Fleming Jerel D | $86,500 | -- | |
| -- | $83,500 | -- |
Source: Public Records
Tax History Compared to Growth
Tax History
| Year | Tax Paid | Tax Assessment Tax Assessment Total Assessment is a certain percentage of the fair market value that is determined by local assessors to be the total taxable value of land and additions on the property. | Land | Improvement |
|---|---|---|---|---|
| 2025 | $1,045 | $24,540 | $1,204 | $23,336 |
| 2024 | $1,045 | $13,268 | $1,204 | $12,064 |
| 2023 | $1,045 | $13,268 | $1,204 | $12,064 |
| 2022 | $978 | $12,881 | $1,204 | $11,677 |
| 2021 | $948 | $12,142 | $1,204 | $10,938 |
| 2020 | $1,012 | $12,725 | $1,204 | $11,521 |
| 2019 | $982 | $12,354 | $1,204 | $11,150 |
| 2018 | $1,023 | $12,863 | $1,204 | $11,659 |
| 2017 | $956 | $12,125 | $1,204 | $10,921 |
| 2016 | $950 | $12,180 | $1,149 | $11,031 |
| 2015 | $916 | $11,826 | $1,132 | $10,694 |
| 2014 | $916 | $11,482 | $1,116 | $10,366 |
Source: Public Records
Map
Nearby Homes
- 1927 High Meadow Dr
- 2018 Woodrock Dr
- 1829 1829 Terrace Dr
- 2403 Meadow View Dr
- 1706 Windsor Dr
- 2360 Rockwell Dr
- 2321 Rockwell Dr
- 2129 W Mallard Dr
- 3990 N Ridgeview Dr
- 2120 2120 Flamingo Ln
- 30 Canterbury Ln
- 28 Canterbury Ln
- 2201 W Club Rd
- 2203 Canary Ave
- 2110 W Club Rd
- 1601 1601 Pearl
- 2202 W Canary Ave
- 2814 2814 Springdale Ln
- 1404 1404 Ne Aspen
- 1527 1527 N 13th
- 2013 Overland Dr
- 2021 Overland Dr
- 2016 Westbriar Rd
- 2020 Westbriar Rd
- 2012 Westbriar Rd
- 2025 Overland Dr
- 2009 Overland Dr
- 2020 2020 Westbriar
- 1935 Ridgeway Cir
- 2008 Westbriar Rd
- 2102 Westbriar Rd
- 2005 Overland Dr
- 1934 Ridgeway Cir
- 1934 Green Briar Cir
- 2105 Overland Dr
- 1931 Ridgeway Cir
- 2106 Westbriar Rd
- 2004 Westbriar Rd
- 1930 Green Briar Cir
- 1930 Ridgeway Cir