
Landlord's Agent in 2025
Violeta Jako-Ostojic
@ Properties
(312) 550-9769
3 in this area
53 Total Sales
Estimated Value: $243,000 - $256,236
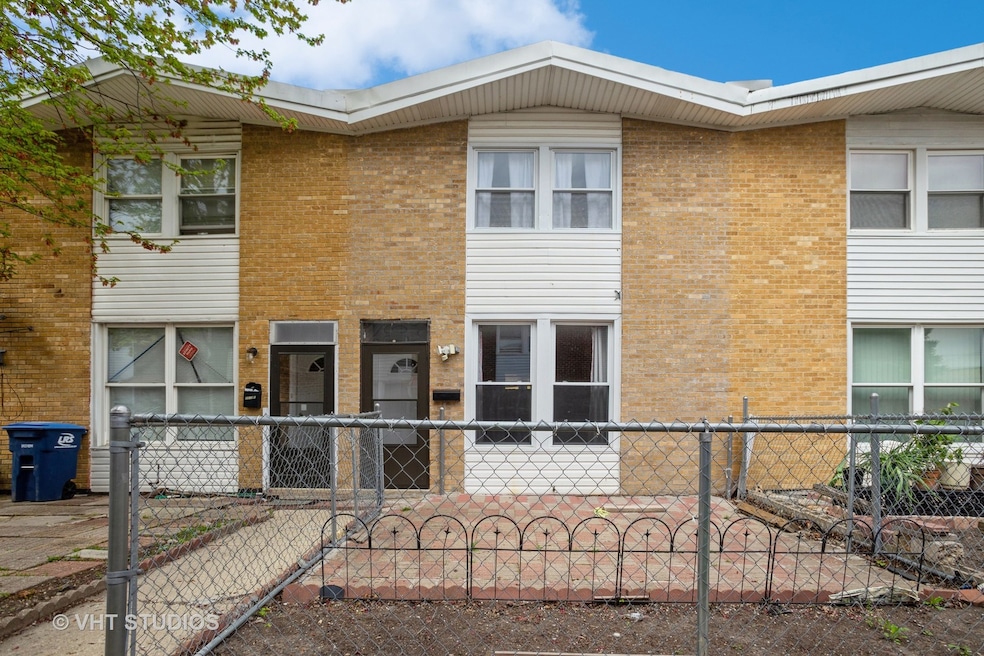
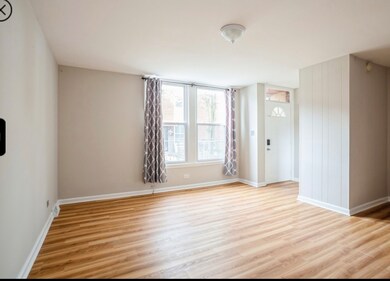
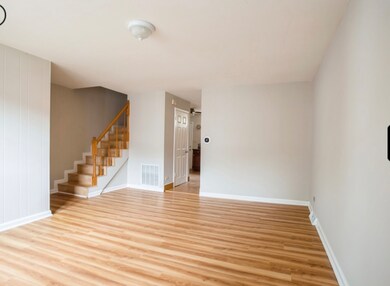
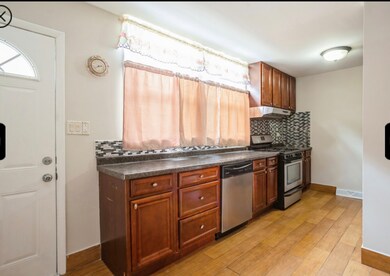
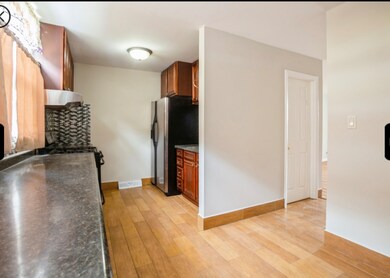
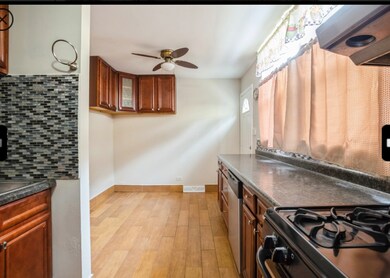
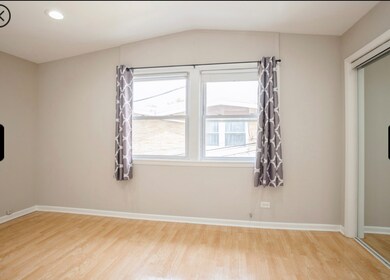
Light and bright, this 3 bed 2 bath townhome is beautifully appointed and freshly painted with neutral colors. Updated baths and kitchen will make you feel right at home. Extra space in the basement can be utilized for a play room, office or work out room. Washer and dryer on premises with plenty of storage space in the laundry area. Additional Fridge in basement. There are two outdoor parking spots by the entrance. Available October 1st.
Last Agent to Rent the Property
@properties Christie's International Real Estate License #475106444 Listed on: 08/20/2025
Last Renter's Agent
Non Member
NON MEMBER
| Date | Buyer | Sale Price | Title Company |
|---|---|---|---|
| Patel Naitikkimar N | $130,000 | Attorney |
| Date | Status | Borrower | Loan Amount |
|---|---|---|---|
| Open | Patel Naitikkimar N | $104,000 |
| Date | Event | Price | List to Sale | Price per Sq Ft | Prior Sale |
|---|---|---|---|---|---|
| 08/31/2025 08/31/25 | Rented | $2,300 | 0.0% | -- | |
| 08/20/2025 08/20/25 | For Rent | $2,300 | +7.0% | -- | |
| 05/14/2024 05/14/24 | Rented | $2,150 | 0.0% | -- | |
| 05/12/2024 05/12/24 | Price Changed | $2,150 | -4.4% | $2 / Sq Ft | |
| 04/11/2024 04/11/24 | For Rent | $2,250 | 0.0% | -- | |
| 03/20/2024 03/20/24 | Sold | $260,000 | -3.7% | $226 / Sq Ft | View Prior Sale |
| 02/04/2024 02/04/24 | Pending | -- | -- | -- | |
| 01/27/2024 01/27/24 | For Sale | $269,999 | -- | $234 / Sq Ft |
| Year | Tax Paid | Tax Assessment Tax Assessment Total Assessment is a certain percentage of the fair market value that is determined by local assessors to be the total taxable value of land and additions on the property. | Land | Improvement |
|---|---|---|---|---|
| 2025 | $5,009 | $19,000 | $3,418 | $15,582 |
| 2024 | $5,009 | $19,000 | $3,000 | $16,000 |
| 2023 | $4,889 | $19,000 | $3,000 | $16,000 |
| 2022 | $4,889 | $19,000 | $3,000 | $16,000 |
| 2021 | $3,846 | $12,511 | $1,452 | $11,059 |
| 2020 | $3,781 | $12,511 | $1,452 | $11,059 |
| 2019 | $3,783 | $14,058 | $1,452 | $12,606 |
| 2018 | $2,909 | $13,162 | $1,281 | $11,881 |
| 2017 | $2,875 | $13,162 | $1,281 | $11,881 |
| 2016 | $2,964 | $13,162 | $1,281 | $11,881 |
| 2015 | $3,155 | $13,059 | $1,110 | $11,949 |
| 2014 | $3,105 | $13,059 | $1,110 | $11,949 |
| 2013 | $3,010 | $13,059 | $1,110 | $11,949 |
Landlord's Agent in 2025
Violeta Jako-Ostojic
@ Properties
(312) 550-9769
3 in this area
53 Total Sales
N
Tenant's Agent in 2025
Non Member
NON MEMBER
R
Seller's Agent in 2024
Rakesh Patel
RP Realty Inc
(847) 372-1523
3 in this area
13 Total Sales
Source: Midwest Real Estate Data (MRED)
MLS Number: 12451803
APN: 09-29-409-027-0000
Disclaimer: Certain information contained herein is derived from information provided by parties other than Homes.com. All information provided is deemed reliable, but is not guaranteed to be accurate and should be independently verified.
![]() Based on information submitted to the MLS GRID. All data is obtained from various sources and may not have been verified by broker or MLS GRID. Supplied Open House Information is subject to change without notice. All information should be independently reviewed and verified for accuracy. Properties may or may not be listed by the office/agent presenting the information. Some IDX listings have been excluded from this website.
Based on information submitted to the MLS GRID. All data is obtained from various sources and may not have been verified by broker or MLS GRID. Supplied Open House Information is subject to change without notice. All information should be independently reviewed and verified for accuracy. Properties may or may not be listed by the office/agent presenting the information. Some IDX listings have been excluded from this website.
Based on information submitted to the MLS GRID
Ask me questions while you tour the home.