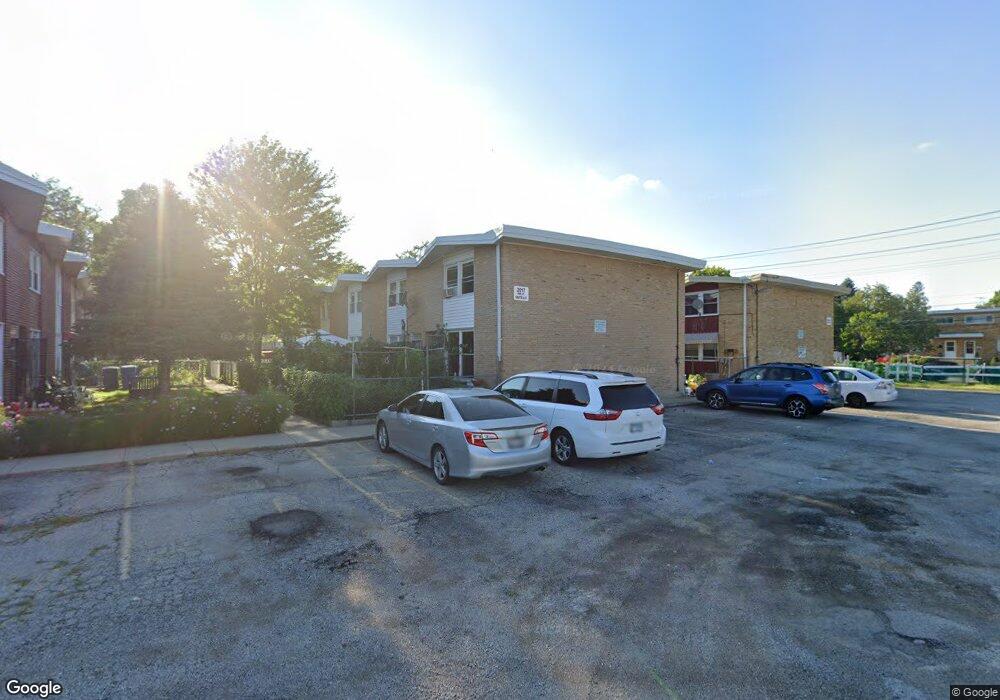
2017 Pine St Des Plaines, IL 60018
Estimated Value: $233,010 - $249,000
3
Beds
2
Baths
1,152
Sq Ft
$211/Sq Ft
Est. Value
About This Home
This home is located at 2017 Pine St, Des Plaines, IL 60018 and is currently estimated at $243,253, approximately $211 per square foot. 2017 Pine St is a home located in Cook County with nearby schools including Plainfield Elementary School, Algonquin Middle School, and Maine West High School.
Ownership History
Date
Name
Owned For
Owner Type
Purchase Details
Closed on
Jan 14, 2022
Sold by
Nair Manish S and Nair Anju Satheesh
Bought by
Patel Komalben
Current Estimated Value
Home Financials for this Owner
Home Financials are based on the most recent Mortgage that was taken out on this home.
Original Mortgage
$167,325
Outstanding Balance
$153,283
Interest Rate
3.12%
Mortgage Type
Purchase Money Mortgage
Estimated Equity
$89,970
Purchase Details
Closed on
Sep 14, 2015
Sold by
Parikh Balkrushna and Parikh Pratima
Bought by
Nair Anju Satheesh Kumar and Nair Manish S
Home Financials for this Owner
Home Financials are based on the most recent Mortgage that was taken out on this home.
Original Mortgage
$133,536
Interest Rate
3.93%
Mortgage Type
FHA
Create a Home Valuation Report for This Property
The Home Valuation Report is an in-depth analysis detailing your home's value as well as a comparison with similar homes in the area
Home Values in the Area
Average Home Value in this Area
Purchase History
| Date | Buyer | Sale Price | Title Company |
|---|---|---|---|
| Patel Komalben | $172,500 | -- | |
| Patel Komalben | $172,500 | -- | |
| Nair Anju Satheesh Kumar | $136,000 | Attorney |
Source: Public Records
Mortgage History
| Date | Status | Borrower | Loan Amount |
|---|---|---|---|
| Open | Patel Komalben | $167,325 | |
| Previous Owner | Nair Anju Satheesh Kumar | $133,536 |
Source: Public Records
Tax History
| Year | Tax Paid | Tax Assessment Tax Assessment Total Assessment is a certain percentage of the fair market value that is determined by local assessors to be the total taxable value of land and additions on the property. | Land | Improvement |
|---|---|---|---|---|
| 2025 | $5,009 | $19,000 | $2,800 | $16,200 |
| 2024 | $5,009 | $19,000 | $3,000 | $16,000 |
| 2023 | $4,889 | $19,000 | $3,000 | $16,000 |
| 2022 | $4,889 | $19,000 | $3,000 | $16,000 |
| 2021 | $2,679 | $12,046 | $1,190 | $10,856 |
| 2020 | $2,703 | $12,046 | $1,190 | $10,856 |
| 2019 | $2,720 | $13,535 | $1,190 | $12,345 |
| 2018 | $2,907 | $13,155 | $1,050 | $12,105 |
| 2017 | $2,873 | $13,155 | $1,050 | $12,105 |
| 2016 | $2,962 | $13,155 | $1,050 | $12,105 |
| 2015 | $3,664 | $12,119 | $910 | $11,209 |
| 2014 | $2,200 | $12,119 | $910 | $11,209 |
| 2013 | $2,196 | $12,119 | $910 | $11,209 |
Source: Public Records
Map
Nearby Homes
- 1370 Fargo Ave Unit E
- 2220 S Chestnut St
- 1445 Everett Ave
- 1696 S Elm St
- 1689 S Elm St
- 1673 Spruce Ave
- 1721 Prospect Ave
- 1645 Illinois St
- 1629 E Touhy Ave
- 1641 E Touhy Ave
- 1080 Bogart St
- 635 Birchwood Ave
- 815 E Oakton St Unit 311
- 1939 E Touhy Ave
- 2323 Douglas Ave
- 1754 E Lincoln Ave
- 1640 S River Rd
- 614 Birchwood Ave
- 2646 Maple St
- 1700 E Forest Ave
Your Personal Tour Guide
Ask me questions while you tour the home.