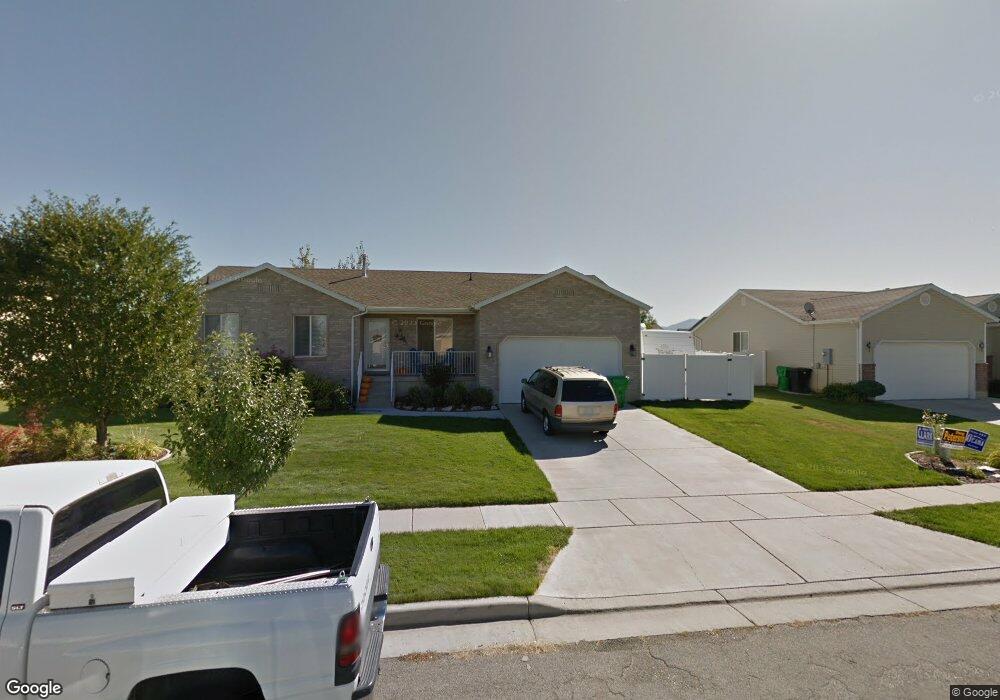
2017 S 1800 W Syracuse, UT 84075
Estimated Value: $491,000 - $551,579
4
Beds
3
Baths
1,380
Sq Ft
$376/Sq Ft
Est. Value
About This Home
This home is located at 2017 S 1800 W, Syracuse, UT 84075 and is currently estimated at $519,395, approximately $376 per square foot. 2017 S 1800 W is a home located in Davis County with nearby schools including Syracuse Elementary School, Syracuse Junior High School, and Syracuse High School.
Ownership History
Date
Name
Owned For
Owner Type
Purchase Details
Closed on
May 29, 2019
Sold by
Peterson Douglas J
Bought by
Peterson Douglas J and Peterson Stephanie E
Current Estimated Value
Purchase Details
Closed on
Jun 25, 2007
Sold by
Peterson Stephanie E
Bought by
Peterson Douglas J
Home Financials for this Owner
Home Financials are based on the most recent Mortgage that was taken out on this home.
Original Mortgage
$92,000
Outstanding Balance
$56,355
Interest Rate
6.21%
Mortgage Type
Credit Line Revolving
Estimated Equity
$463,040
Purchase Details
Closed on
May 20, 1999
Sold by
Lanse Chournos Construction
Bought by
Peterson Douglas J and Peterson Stephanie E
Purchase Details
Closed on
May 11, 1999
Sold by
Bodily Investments Llc
Bought by
Lanse Chournos Construction
Create a Home Valuation Report for This Property
The Home Valuation Report is an in-depth analysis detailing your home's value as well as a comparison with similar homes in the area
Home Values in the Area
Average Home Value in this Area
Purchase History
| Date | Buyer | Sale Price | Title Company |
|---|---|---|---|
| Peterson Douglas J | -- | None Available | |
| Peterson Douglas J | -- | Backman Title Services | |
| Peterson Douglas J | -- | Security Title Company | |
| Lanse Chournos Construction | -- | First American Title Co |
Source: Public Records
Mortgage History
| Date | Status | Borrower | Loan Amount |
|---|---|---|---|
| Open | Peterson Douglas J | $92,000 |
Source: Public Records
Tax History Compared to Growth
Tax History
| Year | Tax Paid | Tax Assessment Tax Assessment Total Assessment is a certain percentage of the fair market value that is determined by local assessors to be the total taxable value of land and additions on the property. | Land | Improvement |
|---|---|---|---|---|
| 2025 | $2,845 | $274,450 | $125,831 | $148,619 |
| 2024 | $2,712 | $263,450 | $104,899 | $158,551 |
| 2023 | $2,531 | $448,000 | $146,116 | $301,884 |
| 2022 | $2,743 | $266,200 | $83,997 | $182,203 |
| 2021 | $2,437 | $366,000 | $124,222 | $241,778 |
| 2020 | $2,146 | $312,000 | $107,795 | $204,205 |
| 2019 | $2,055 | $295,000 | $105,873 | $189,127 |
| 2018 | $2,035 | $290,000 | $101,977 | $188,023 |
| 2016 | $1,769 | $132,220 | $39,123 | $93,097 |
| 2015 | $1,686 | $120,010 | $39,123 | $80,887 |
| 2014 | $1,656 | $120,080 | $39,123 | $80,957 |
| 2013 | -- | $105,785 | $32,326 | $73,459 |
Source: Public Records
Map
Nearby Homes